No lessons found...
No posts found...


Articles - All you need to know about Excel
Tips, guides & news
-
 Guest blog
The new super function XLOOKUP in Excel
In this article our guest writer Carl Stiller deconstructs the function XLOOKUP and tell you why you should use it.
CarlSkribent7 Jul, 2025 -
 Guest blog
Cleaning data part 3 of 3 – Find and Replace as well as the Text to Column function
To determine numeric values, marking cells for sums in the status bar is a simple approach. Customizing the status bar...
Carolina BinazziSkribent29 Aug, 2023 -
 Guest blog
Cleaning data part 2 of 3 – Having numbers formated as text?
In this article, we'll be delving further into data cleansing and tackling the issue of handling numerical values presented in...
CarlSkribent19 Jul, 2023 -
 Guest blog
How to Clean Data in Excel and 4 examples of Absolute and Relative Cell Reference
Data cleaning – not the most exciting task, but it's essential to make use of the raw data we've gathered...
Carolina BinazziSkribent7 Jul, 2023 -
 Guest blog
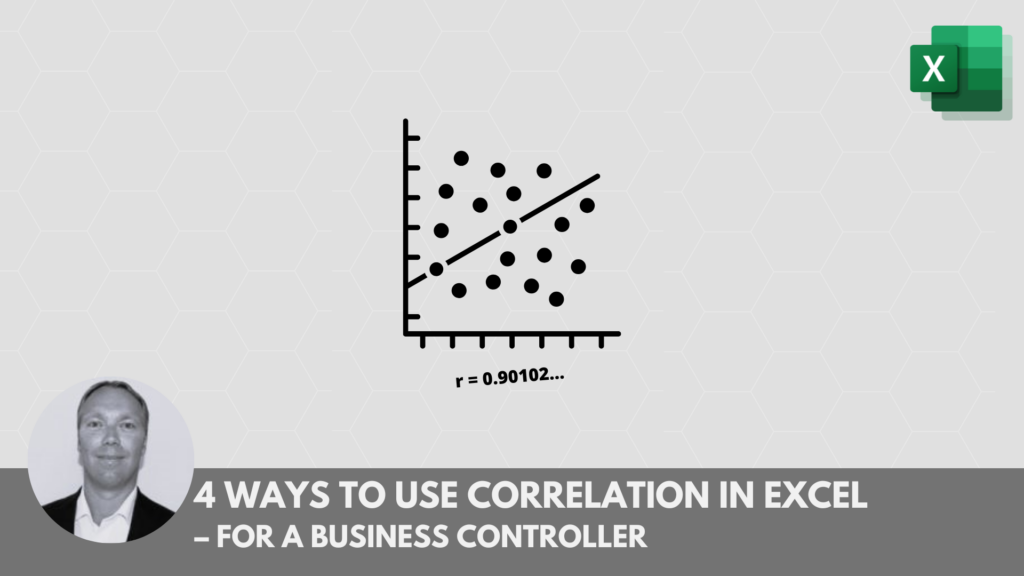
4 ways to use Correlation in Excel for a Business Controller
Discover the hidden connections within your data using Excel's correlation analysis. Gain valuable insights and make informed decisions with ease.
 NiklasProduktutvecklare23 May, 2023
 -
 Guest blog
5 ways to insert reports from Excel
Learn different methods for exporting content from Excel
CarlSkribent10 Oct, 2022 -
 Guest blog
How to work in Excel with PivotTables and Calculated fields
Calculated fields = PivotTables on steroids!
Carolina BinazziSkribent30 Mar, 2021 -
 Guest blog
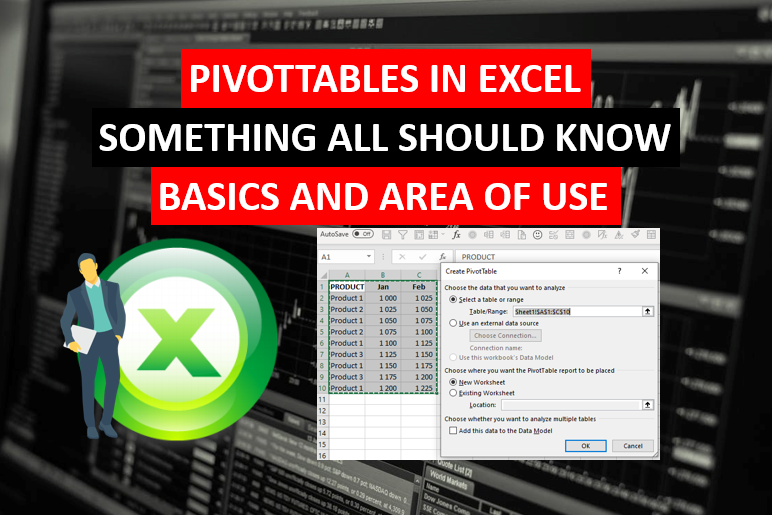
PivotTables in Excel, something all Excel users should know!
PivotTables are something that all Excel users should master well and one of the first things one should consider learning....
Carolina BinazziSkribent9 Mar, 2021 -
 Guest blog
How to succeed with Doughnut Charts in Excel
Doughnut charts can be a perfect tool to visualize results or percentage of achieved goals.The charts can be a bit...
Carolina BinazziSkribent22 Feb, 2021 -
Guest blog
Conditional and custom formatting in Excel, is it worth the effort?
Is it…? Is it worth the time you need to spend before you learn the function… and even after? There...
CarlSkribent2 Feb, 2021 -
 Guest blog
Shortest path problem with Excel solver
In today’s post, you will learn how you can use Excel for solving the shortest path problem. The shortest path...
 EmilSkribent26 Jan, 2021
 -
 Gästblogg
⭐ Master Excel’s SUMPRODUCT in 7 steps ⭐
We have now come to the post for the powerful function SUMPRODUCT… my favourite function. I became acquainted with this...
CarlSkribent12 Jan, 2021