5 ways to insert reports from Excel
Pasting reports … should it be that hard to get it right??
If we have now prepared a report numerically and need to insert it in PowerPoint or in a Word document, how do we do it? There are several ways and I will show how I normally do.
Read the post in Swedish here

Watch at the lesson in Learnesy’s course Datavisualisering
Go to the shop
The report
If we have a finished report in Excel, it can possibly include quite a lot of information. If so, let it stay in Excel! If you need to insert a report to, for example, a Town Hall meeting, a comprehensive report has no function, keep it simple! No one watching a PowerPoint presentation with too much information will be able to interpret and digest it as it probably will be unclear and confusing.?
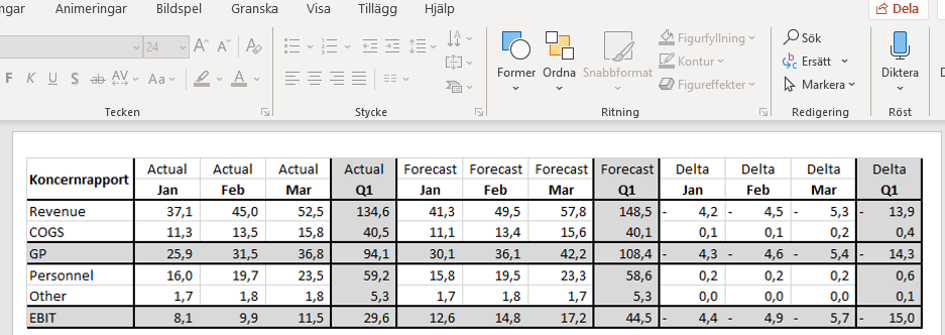
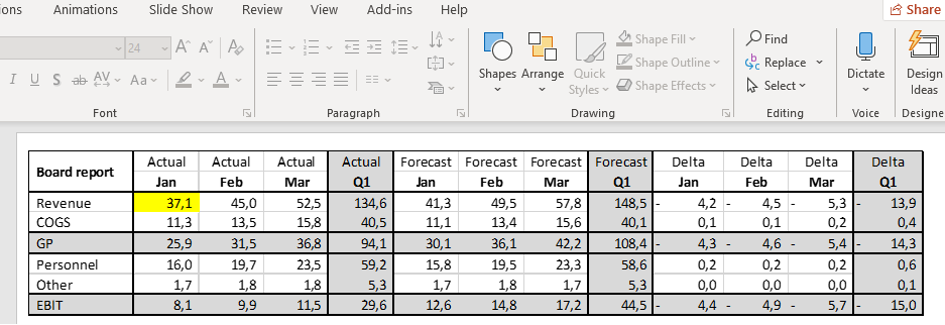
The report below, for example, is far too comprehensive and detailed to include in a PowerPoint presentation:
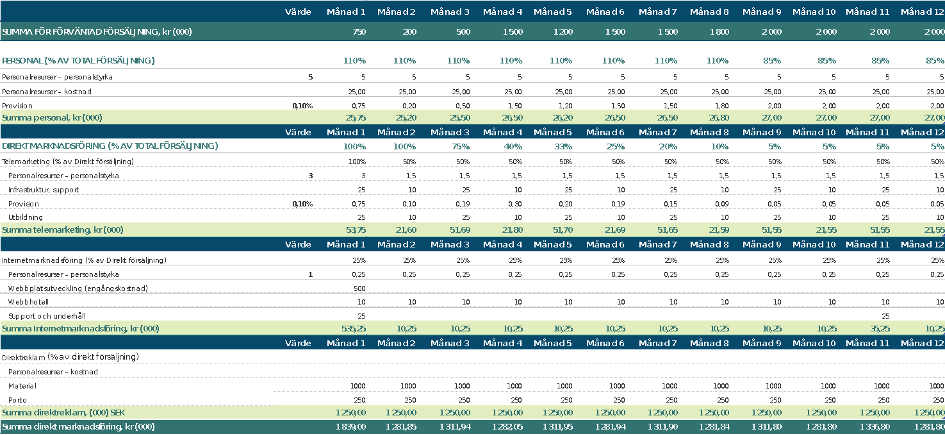
For presentations, hold down the numerical information to only what is needed and no more.
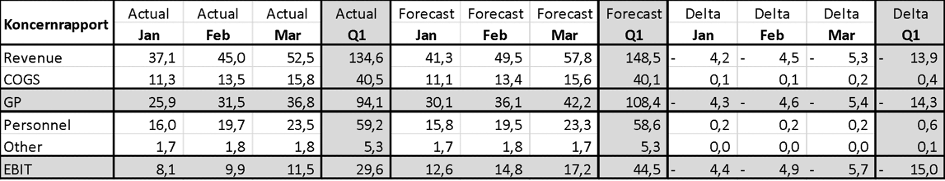
Below report on group account level works better:
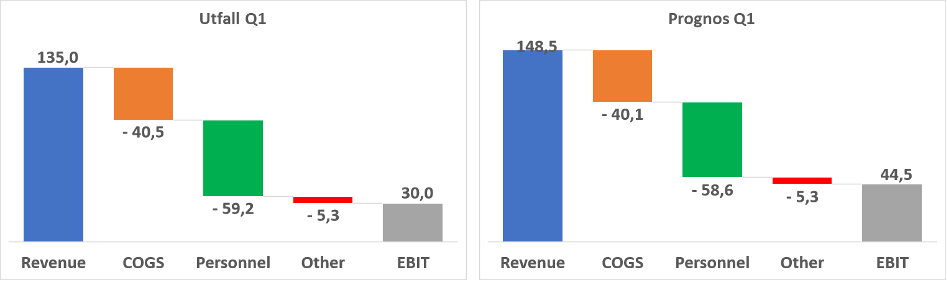
Making the report visual is also a good option. Below report is a waterfall chart. This type of chart shows very clearly the amounts, revenues and how the cost items affect the result. ?
5 ways to insert reports
There are different ways to put reports in a presentation, they have slightly different advantages and disadvantages, which I explain below.
1. Copy and paste
Easiest way and fastest. If you copy an Excel report, you can use Ctrl+C and Ctrl+V to paste the image. When pasting, the image rarely has the right size or format, so you need to take another step and that is to choose pasting options.
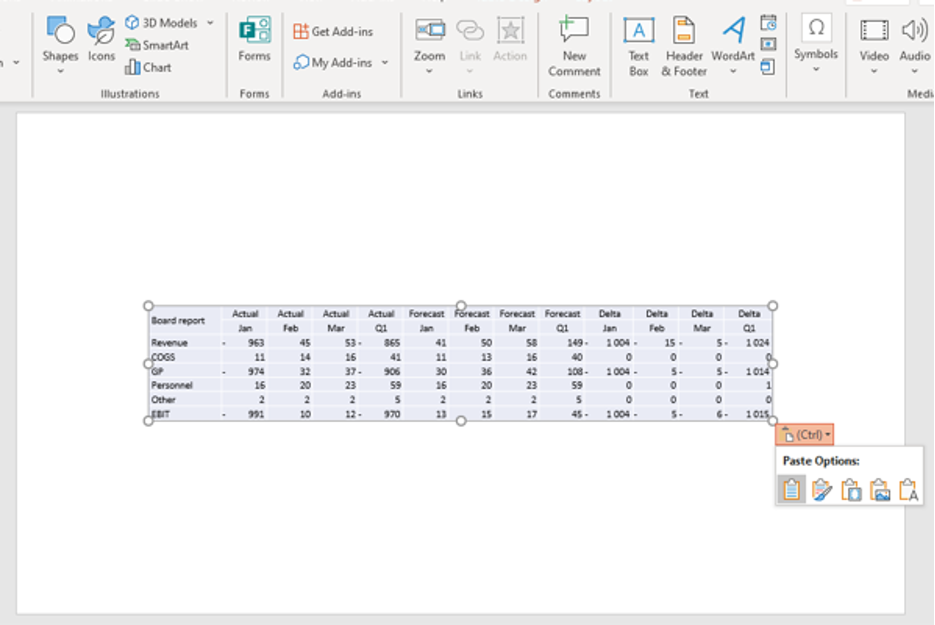
The different icons mean different commands:
- Use destination style
- Keep source formatting
- Embed
- Picture
- Keep text only
The first alternative does not look good in a visual way and in alternative 2 you can accidentally access the numbers. The last option is text only. I usually choose to paste an image as this is usually the most flexible solution, however, the image can sometimes lack sharpness and become somewhat indistinct.?
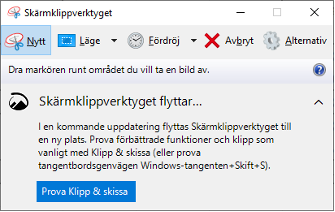
2. Screenshot tool
This tool is flexible and quick to use. I usually have this tool on my taskbar as I use it so often. When you click on “new”, the background you have open becomes a bit foggy and you can select the area you want to copy. I had a CFO once that I reported to who was annoyed that the pictures became too blurry with this tool… you cannot always make everyone happy☹.
3. Paint
What I have noticed is that the reports are sharpest if you first run a Ctrl+C and then Ctrl+V in the program Paint and then adjust the size. As you can see below, you only see the report and no white background around it.
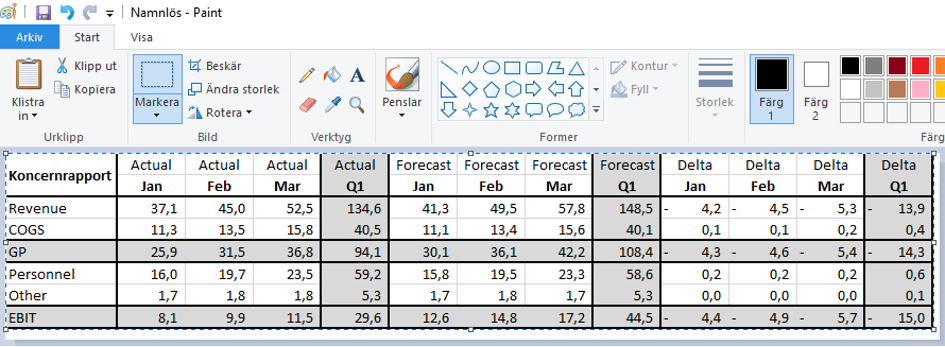
I usually save as a PNG file, then paste it as a file via the insert menu. This variant takes a little longer but the result is good.
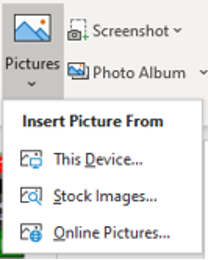
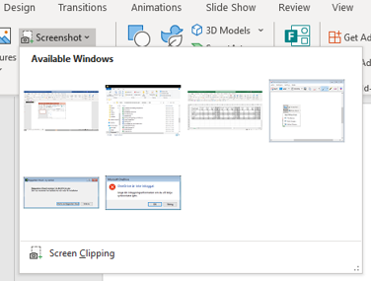
4. Insert screenshot
You can now also insert a screenshot, which is a quick solution but does not optimize page usage as the entire Excel image is included.
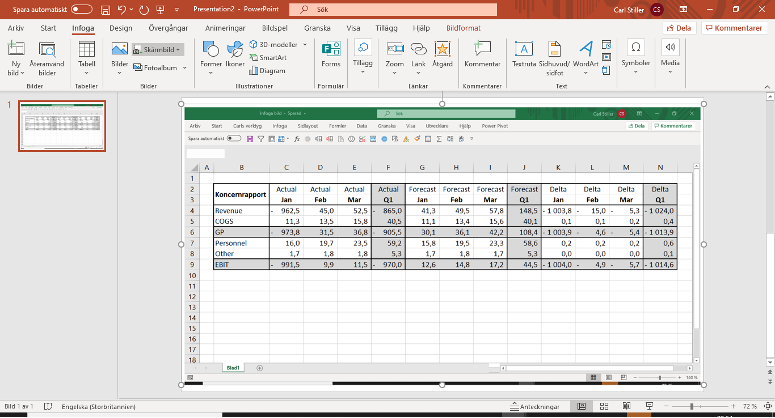
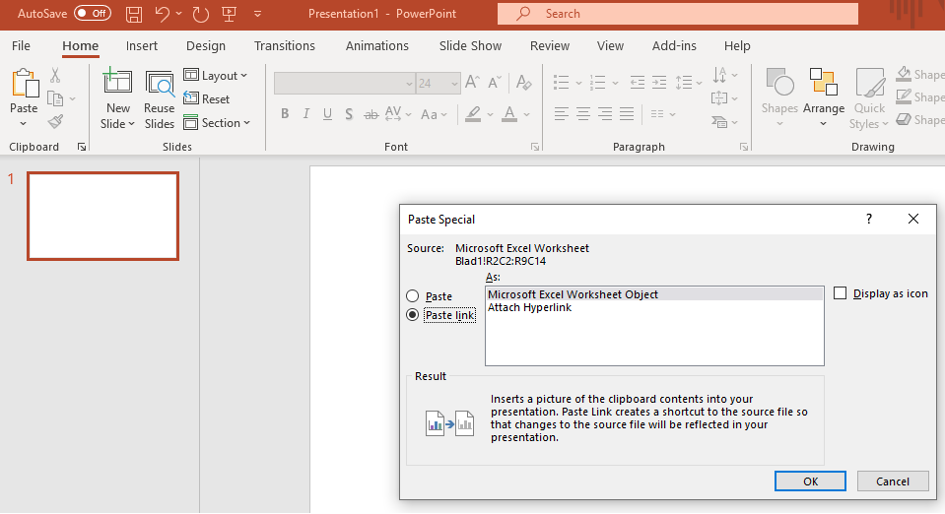
5. Paste special
This variant allows you to paste images/reports that are linked to the Excel report and becomes updated if Excel is updated. You copy the Excel report, go to PowerPoint and from the Home menu you choose paste special… Paste link.
Before adjustment…
After adjustment… where the income for January has changed after a correction in Excel.
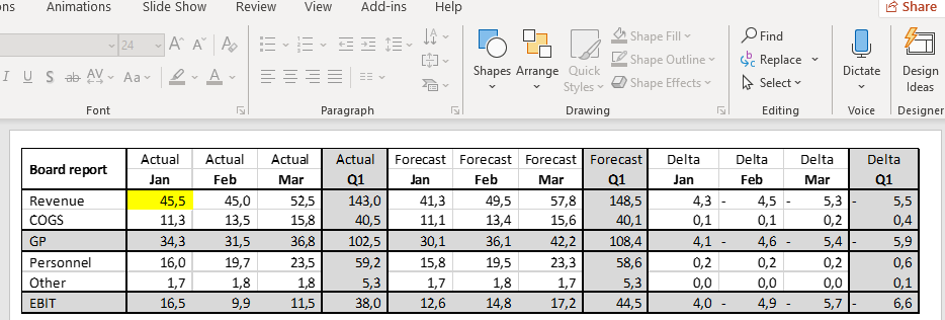
I personally have stopped using this alternative as there are sometimes issues with reports being updated automatically in PowerPoint. The last thing you want is for the numbers to change just before a meeting.?Of course you can use this variant without links.
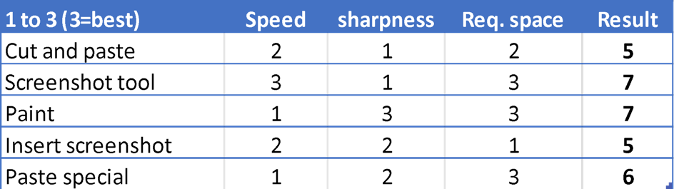
Conclusion
My favourites are thereby rated as follows:
Next post
This slightly shorter post has dealt with different ways to insert pictures and reports and tips on what to think about when presenting. The next post will be about visualisation using conditional formatting.
Feel free to connect with me on Linkedin and go to Learnesy´s website for more information.
Carl Stiller in collaboration with Learnesy