4 ways to use Correlation in Excel for a Business Controller
Correlation indicates in statistics the strength and direction of a relationship between two or more variables. The correlation is often stated with a correlation coefficient. One method for determining the correlation between two variables is bivariate analysis. The correlation coefficient has a value between 1 and -1, where 0 indicates no relationship, 1 indicates the maximum positive relationship and -1 indicates the maximum negative relationship.
Source: Wikipedia
Read the post in Swedish here
What is correlation?
In short, it can be said that correlation is about, whether or not, a couple of variables fluctuate or not. However, it should be remembered that correlation does not have to mean causation. Just because two things react similarly does not mean that one causes what happens to the other. In the economy, we can often see clear connections between, for example, the number of visitors and revenue or between market costs and revenue. See below illustration where the costs are on axis number 2 and have a positive value:
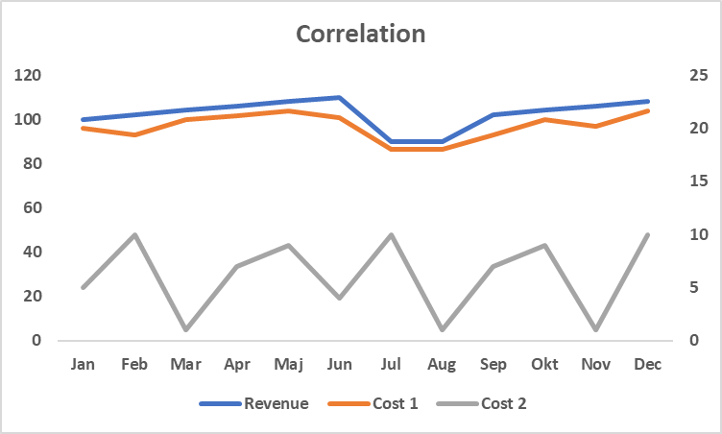
The correlation above is as much as 0.9 for cost 1 and only 0.1 for cost 2. COGS or direct manufacturing costs are an example of costs that usually have a high correlation with revenue as the sales price is usually set in relation to direct and indirect manufacturing costs and the margin you want. Promotional costs are another example of a cost that usually follows the revenue curve.
What do I use correlation for?
I usually use the correlation function; CORREL to the following work:
- Financial statements reconciliation
- Budgeting
- Implementation driver-based forecast
- Campaign Analysis
Scenario analysis is another area where you may need to understand correlations in a company. There are certainly a lot you can use the function for, but it is mainly for the above work I use the function in Excel.
The function in Excel
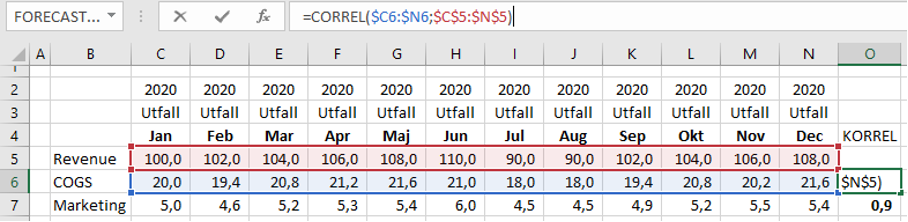
The function is very simple in Excel, start typing CORREL or KORREL (if you have a Swedish setting) and Excel will find the function. Select the first factor you want to compare and click “;” before selecting the comparison factor. Note that an equal amount of observations are not needed for the formula to work, but as many columns in the formula.
Financial statements reconciliation
Certain costs such as travel costs, car costs and market costs often correlate strongly with sales. You can with advantage use CORREL to help verify which costs are linked to, for example, sales in a company.
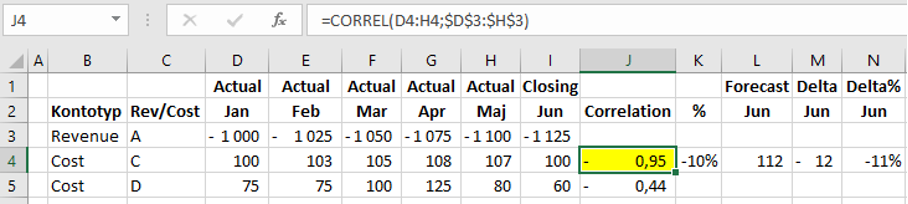
In the example above, we see that cost C has a correlation of almost -1, which is the highest possible correlation. This says that cost C and income A are highly linked and that June’s value in the financial statements should be around 112 if it is assumed that C normally accounts for 10% of A. To work with correlations in financial statements and when doing cost analysis and revenue analysis is very valuable. Spending time understanding what correlates with what in a company can provide great benefits and is something I usually start with as a consultant if I want to understand what affects what in a company.
Budget
If you have done your correlation analysis and found a number of costs such as COGS, car costs, market costs, etc. that are related to sales, you can with advantage calculate an index for how to apply the costs in a budget or in a forecast. What can complicate things is that the accounting department may “not always keep up” and CORREL gives a lower correlation than it should. What I mean here is that if the finance department has not received an invoice for a cost that should correlate with sales, and fails to reserve the cost, the correlation will be lower than it should be. You may need to harmonise the cost picture before calculating the correlation.
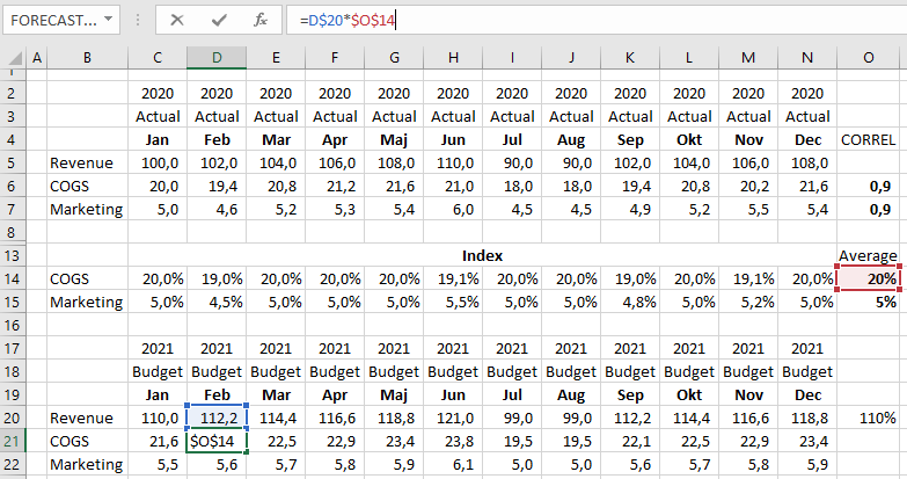
Above you see an example of how you can quickly give a budget proposal for 2021 based on having analysed the correlation and calculated an index or ratio for costs in 2020. The company management here assumes a revenue increase of 10% and it is up to the controlling department to calculate a proposal for remaining costs.
Driver-based forecast
What I usually do when I work with the development of budget or forecasting processes is that I look at the correlation and which costs are easy to predict based on, for example, sales or number of employees.
Drivers are the most important efforts and activities that drive a business’s operational and financial results. Common examples are number of sellers, number of stores, website traffic, marketing campaigns, production units.
Other large costs that do not correlate with anything, I usually distinguish and later break down into activities and forecast separately.
Campaign Analysis
When I worked at Apoteksgruppen, I did a lot of campaign analysis, which was incredibly fun. Trying to discern patterns and understand the impact of campaigns is not always easy. What I analysed was not just how the campaign and sales were connected, but also how long the campaign effect lasted after the campaign was over and whether they jumped up a notch regarding normal sales.
The 2 examples below show that different offers work differently and affect sales differently. Test if you can figure out which offer affects total sales the most in the 2 cases and if you can discern an improvement in total sales thanks to the campaign?
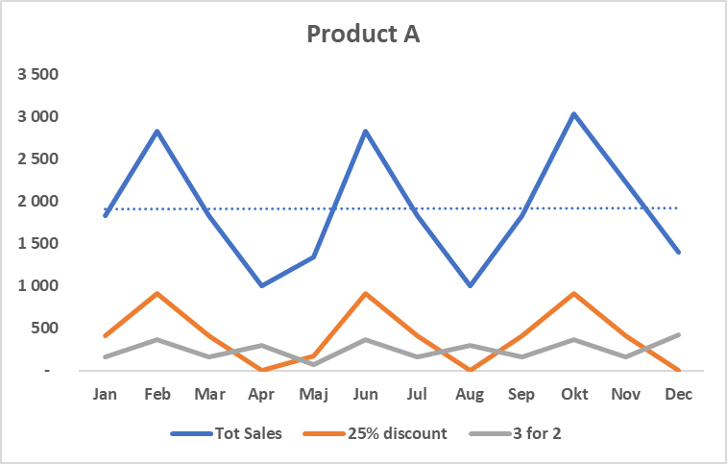
Product A shows that the 25% discount correlates to 1.0 with total sales and only 0.2 with the offer 3 for 2. The regular sales increase significantly during the campaigns and it is not only the discounted sales that contribute to increased total sales. However, the trend is steady and not rising or falling. The conclusion is that if you do not run a campaign, sales would not be so high, however, it can affect profitability with extensive campaigns.
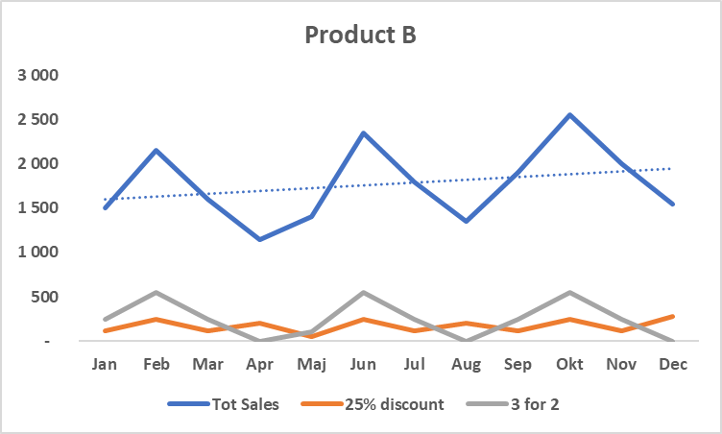
In Product B’s case, it is the reverse where “3 for 2” correlates well with sales, which has a rising trend and peaks during the campaign. One can assume here that campaign can be important in the event of a gradual increase in trend, which is what one wants to achieve.
Next post
In this post, I have shown that the CORREL function is great for reconciliations and forecasting, but that it can also be used for other analysis. Check out one of my other posts, where I show how to easily make a professional doughnut chart and when I usually use it.
Want to know more about me? Feel free to connect with me on Linkedin or read this article.
Carl Stiller in collaboration with Learnesy