


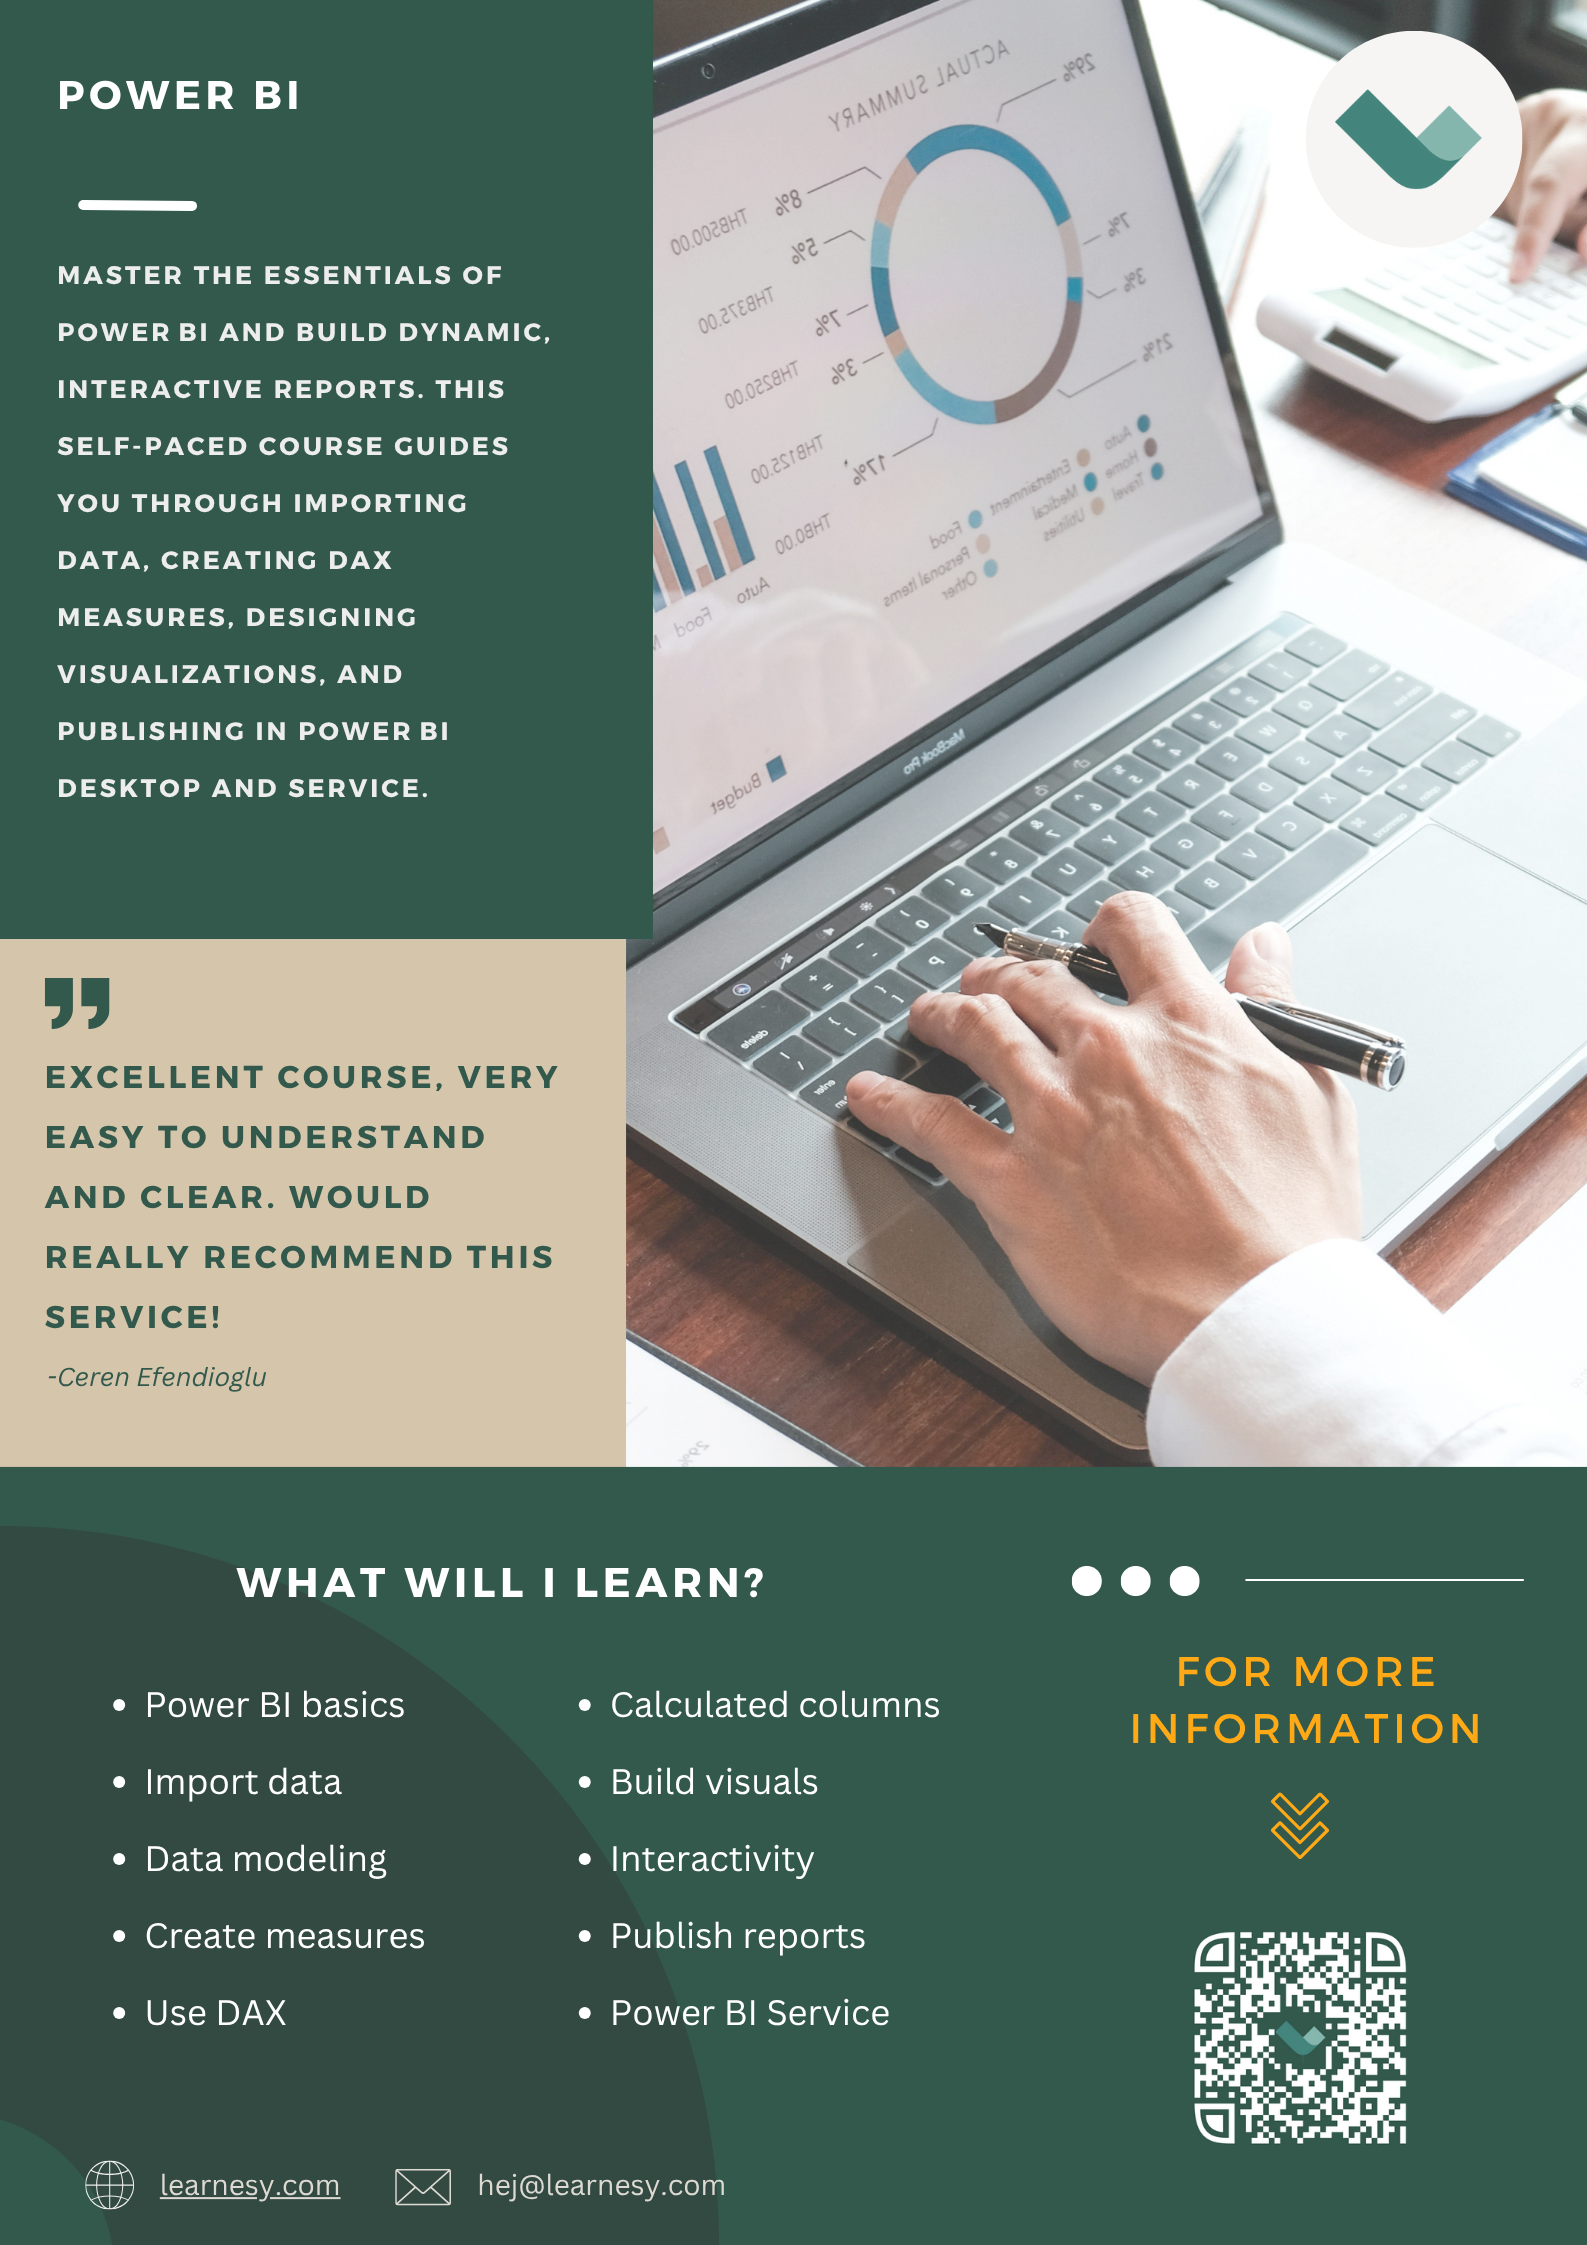
Learn the basics of Power BI
Create dynamic reports and visualizations over large datasets using DAX formulas. In the course, a complete report is built from scratch, helping beginners follow all the steps involved in building a report in Power BI.
Power BI is Microsoft’s business intelligence service. Business intelligence includes several data-related concepts, such as business analysis and visualization. Users of Power BI can therefore easily gain an overview of an organization’s data and make well-informed, data-driven decisions.
- Become the one who turns numbers into insights
- Build interactive dashboards that create value
- Practice with real business data in Power BI
- Used by companies and universities
Try some lessons in this course for free
Fill in your e-mail address and telephone and we will give you 7 days free access to some lessons in this course.


Try some lessons in this course for free
Fill in your e-mail address and telephone and we will give you 7 days free access to some lessons in this course.
Some of the things you will learn in this course:
Dynamic reports and visualisations
Create meaningful visualisations and reports with dynamic functionality. Learn how Power BI visualisations let you see your analytics from new angles.
DAX
Learn several DAX functions and the logic behind measures in Power BI. Measures help you quickly develop effective analytics on data, and this course teaches you many useful functions to help you effortlessly analyse and explore data.
Calculated columns
Create an understanding of how related tables work by extending your tables using calculated columns.
The Power BI Service
Share your reports and analytics using the Power BI service. The service allows you to explore reports internally within an organisation. You’ll also learn how to publish your reports to, for example, a web page.
A lesson from the course
In this lesson from our Power BI course, you’ll learn how to publish their report from Power BI Desktop. The lesson is one of several in the chapter Working with Columns. In this chapter, one also learns about date functions, SWITCH, and logical operations. Before publishing your report, you should review a few overarching things. Ensure that all visualizations, titles, and explanations are correct and convey the message you want to deliver. Don’t forget that a Power BI account is required before you can publish your report in this manner.
Power BI is Microsoft’s service in business intelligence. Business intelligence is about analyzing and summarizing data to gain a better understanding of a business. With Power BI, you can easily visualize big data and gain insights that allow you to make well-informed decisions quickly. In Power BI, you can publish reports to the web and easily share your reports with your colleagues.
More about the course
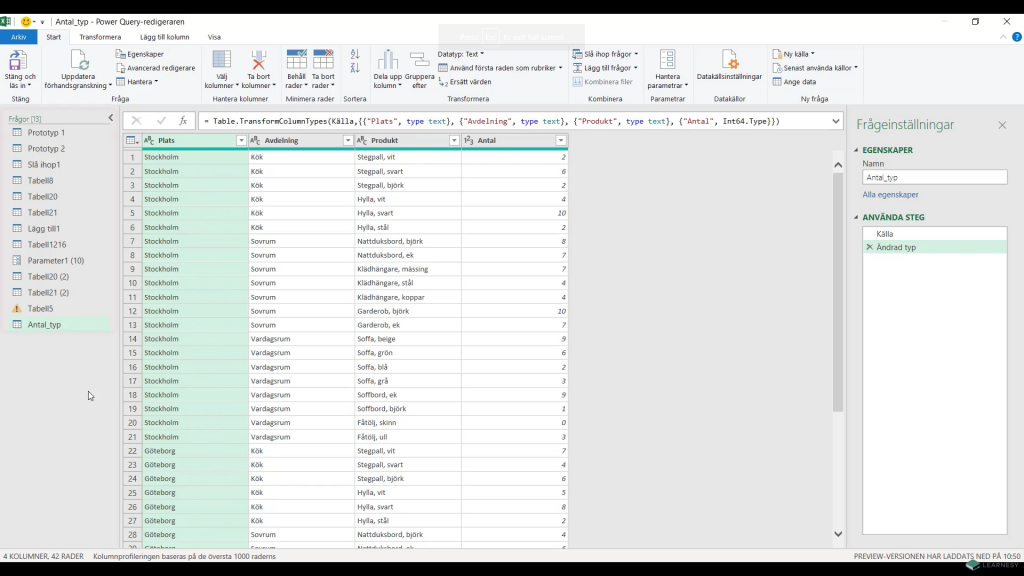
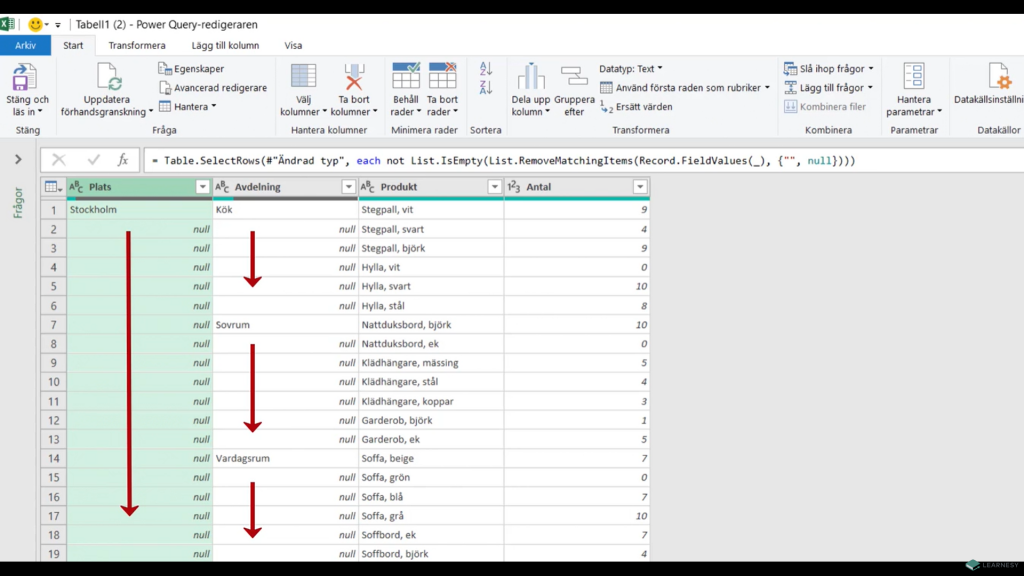
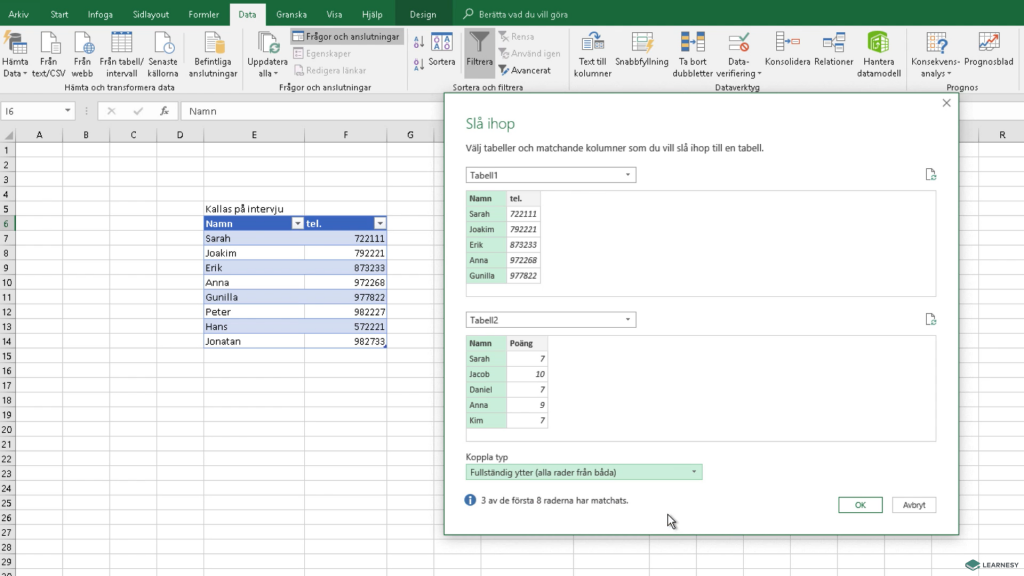
Power BI is Microsoft’s business intelligence service. Business Intelligence is all about analysing and processing data in order to create a better understanding of an organisation. In the course, you will learn Power BI’s basic features as well as how the service works in general. You will learn, among other things, how to Get, visualise, transform, and share data.
- Target group: Beginners and self-taught.
- 19 lessons divided into 5 chapters.
- Total video time: 51 minutes.
- Estimated time to do the course including quizzes: 2-3 hours.
- Personal shareable course certificate after completing 100% of the course.
Invest in your knowledge
Educational scheme
- Access to all material 24/7 for 12 months
- Short lessons with practical examples
- Phone and email support in Swedish and English
- Study at your own pace, with no fixed schedule
- Courses that are maintained and updated
- Personal and digitally shareable diploma
Prices & Packages
Power BI (Single course)
3 495 kr
/year excl. VAT
Invoice • Card • Klarna • Apple pay
✔ Practical exercises and certificate
✔ 12 months of unlimited access
All courses (Incl. Power BI)
6 995 kr
/year excl. VAT
For your team (Multiple users)
Quote
Free of charge
✔ Tailored for all skill levels
✔ Dedicated account for every user
✔ Multi-user discounts
✔ Dedicated Success Manager
Learn more +
Secure payment with
How Your Learnesy Course Works
At Learnesy, we believe that education should be accessible and straightforward. That’s why we’ve created a platform with you, the user, at the center. Within the platform, you can easily navigate in and between your online courses.
• My Account – here you’ll find your dashboard, where you can access both ongoing and completed courses. Your dashboard is the starting point for your learning journey.
• Get a glimpse of a Learnesy course – from your dashboard, you can easily click through to an ongoing or completed course.
• Favorite and share lessons – found a particularly useful segment or something you want to review again? You can save these by marking them as favorites. You can also share lessons with others who might benefit from them.
• Quizzes and practice exercises – practice makes perfect. Here, you put your theoretical knowledge into action. All quizzes, as well as all course content, can be repeated.
• Congratulations on your course diploma – upon completing a course, you’ll receive a personal, shareable diploma as proof of your new skills.
Have a question? You might find your answer here. If not, don’t hesitate to contact us.
FAQ
What does the Power BI course cover?
This beginner-friendly course teaches you how to build reports, dashboards, and visualizations in Power BI. You’ll also learn DAX formulas, calculated columns, and how to use Power BI Service.
How long does the course take to complete?
The course includes 19 video lessons and takes about 4–5 hours to complete.
Who is this course for?
Power BI Essentials is perfect for beginners or anyone self-taught who wants to start working with data in Power BI.
How long do I have access to the course?
You get 12 months of full access and can review all lessons as many times as you want.
Do I get a certificate after finishing the course?
Yes, you receive a personal and shareable digital certificate after completing all lessons and quizzes.
Can I try the course before I buy it?
Yes, you can access selected lessons free for 7 days with no commitment.
Do you offer business or team packages?
Yes, we offer discounts and licenses for companies and groups. Contact sales@learnesy.com to get a quote.
Is this course included in All Courses?
Yes, all our courses are included in the All Courses package. This means you get access to this course together with the entire Learnesy course catalog.
Who can I contact for support or other questions?
For all inquiries, contact us at support@learnesy.com and we’ll be happy to help.
Related courses


The leading provider of digital excel courses in the nordics
Trusted by leading universities, companies, government agencies, schools, and professionals throughout the Nordics.


