No lessons found...
No posts found...


Articles - All you need to know about Excel
Tips, guides & news
-
 post
postTop 3 Best Excel training for procurement teams in Swedish(2026)
Most procurement professionals in Sweden learned Excel by figuring it out as they went. A formula here, a PivotTable there,...
 NiklasProduktutvecklare20 May, 2026
 -
 post
postHow Logistics Companies Train Excel Skills at Scale with Learnesy
Logistics runs on spreadsheets. Freight costs, delivery timelines, warehouse capacity, supplier data, and route planning. Most operations teams rely on...
NiklasProduktutvecklare15 May, 2026 -
Uncategorized
New Course: Excel Intermediate
Already comfortable with Excel? The Excel Advanced Course is your next step. Learn how to manage large datasets with PivotTables,...
NiklasProduktutvecklare17 Jun, 2025 -
 post
postWe create online courses that make a difference
Learn the basics of Excel and data analysis – quickly, smoothly, and practically. Perfect for those who want to get...
NiklasProduktutvecklare15 May, 2025 -
 post
postDiscover Excel’s Function Translator
Learn how you can translate entire formulas with Excel's Function Translator, a Microsoft add-on that translates functions and delimiters.
NiklasProduktutvecklare29 Feb, 2024 -
 post
postTip: Download our Excel Gantt Chart
Download our Gantt chart attached in the article.
NiklasProduktutvecklare15 Feb, 2024 -
 Uncategorized
Why Learn SQL in 2024?
Focusing on 2024, this article highlights how SQL aids in managing larger datasets and performing more complex data manipulations, addressing...
NiklasProduktutvecklare22 Jan, 2024 -
 post
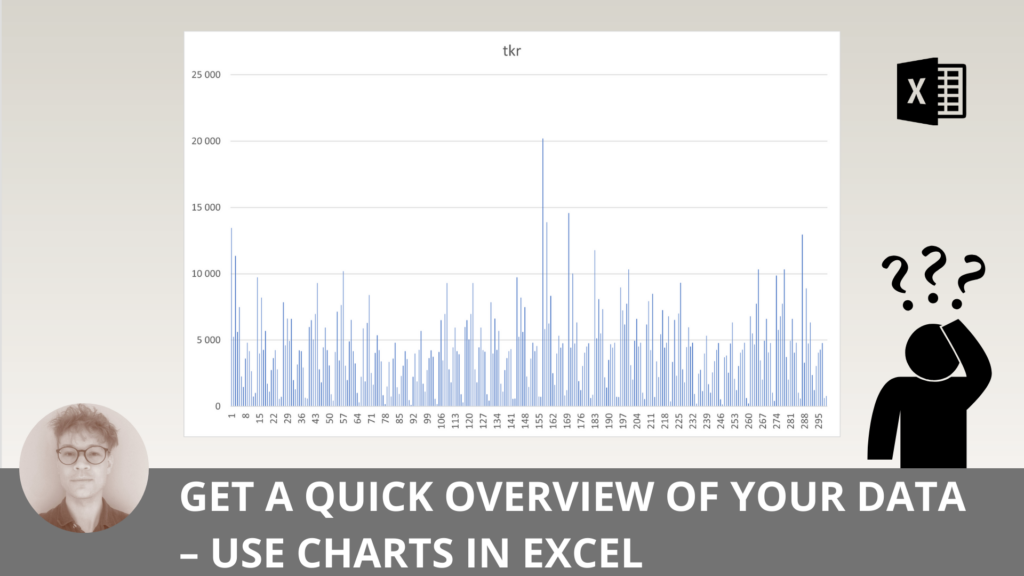
postSanity check your data with disposable charts in Excel
This text explores the importance of 'sanity checks' in data analysis, highlighting the use of disposable charts in Excel for...
NiklasProduktutvecklare4 Jan, 2024 -
 post
postExcel vs. Power BI – which one should you choose?
In this article, two powerful tools for data management and analysis, namely Excel and Power BI, are compared. Learn about...
NiklasProduktutvecklare5 Dec, 2023 -
 News
NewsFall offer: Reduced price and extended access
499 SEK per month, immediate access, and throughout 2024!
NiklasProduktutvecklare9 Nov, 2023 -
 post
postBoost Productivity and Teamwork with Collaborative Excel Workbooks
In the contemporary business landscape, effective collaboration is an imperative. Organizations are continually seeking streamlined methods for team cooperation and...
NiklasProduktutvecklare23 Oct, 2023 -
 post
postDynamic Array Functions in Excel: Efficient Data Manipulation
Dynamic array functions, introduced in Excel 365 and Excel 2019, have transformed data handling and analysis. These functions, including FILTER,...
NiklasProduktutvecklare10 Oct, 2023