Run simulations using Excel
Today we are going to have a look at how we can make simple simulations in Excel using the Monte Carlo simulation method, which uses random sampling to simulate different scenarios.
The simplest example of a Monte Carlo simulation is perhaps tossing a coin. If you toss a coin 100 times, you can roughly expect to get heads 50 times and tails 50 times. Instead of calculating the probability of 1/2, we can as well simulate 100 tosses and record the outcomes to count the probability.
Monte Carlo methods are mainly used in three problem classes: optimization, numerical integration, and generating draws from a probability distribution.
In this example we are going to solve the following probability distribution problem with Monte Carlo in Excel:
“Ten couples are randomly placed in a row. Work out the probability that no husband and wife stand next to each other“
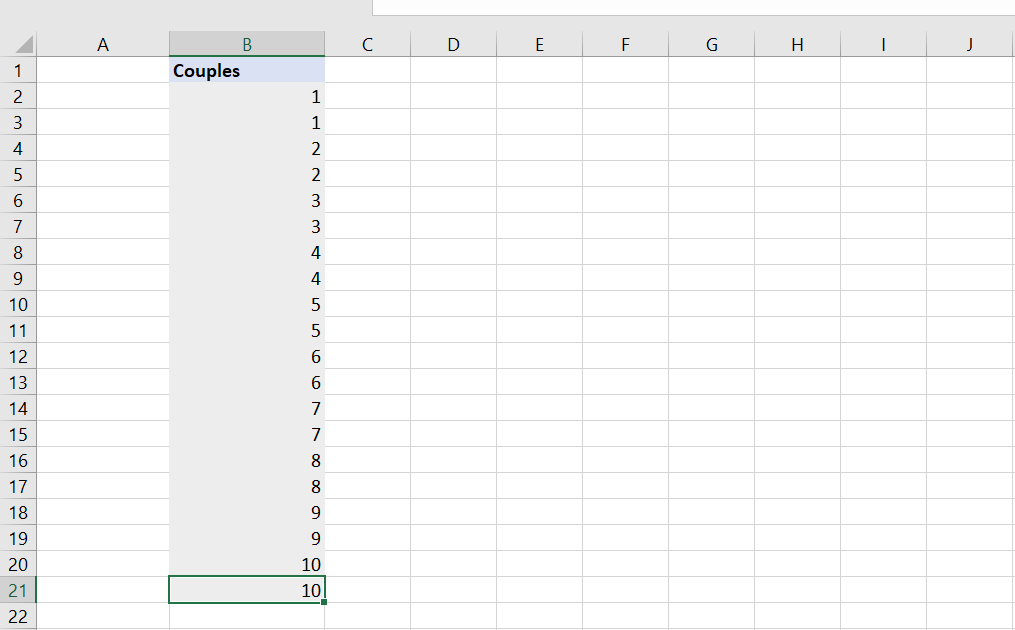
Let’s start by making a list of 20 persons with a number identifying each couple.
Now, we need to simulate the scenario where all persons are randomly placed in a row. Excel does not have a built-in-feature for shuffling a list, so we need get a little creative here.
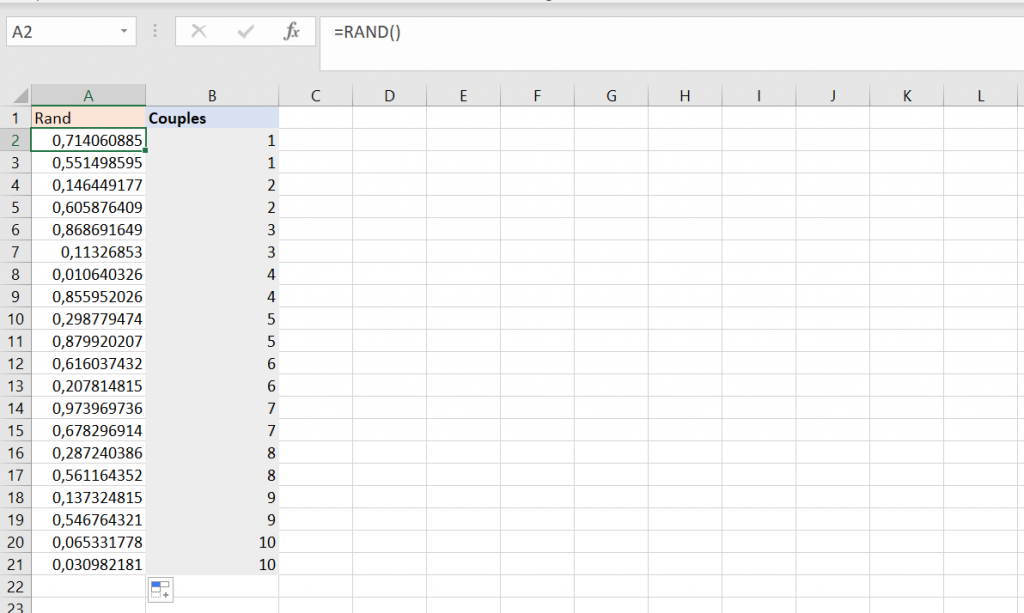
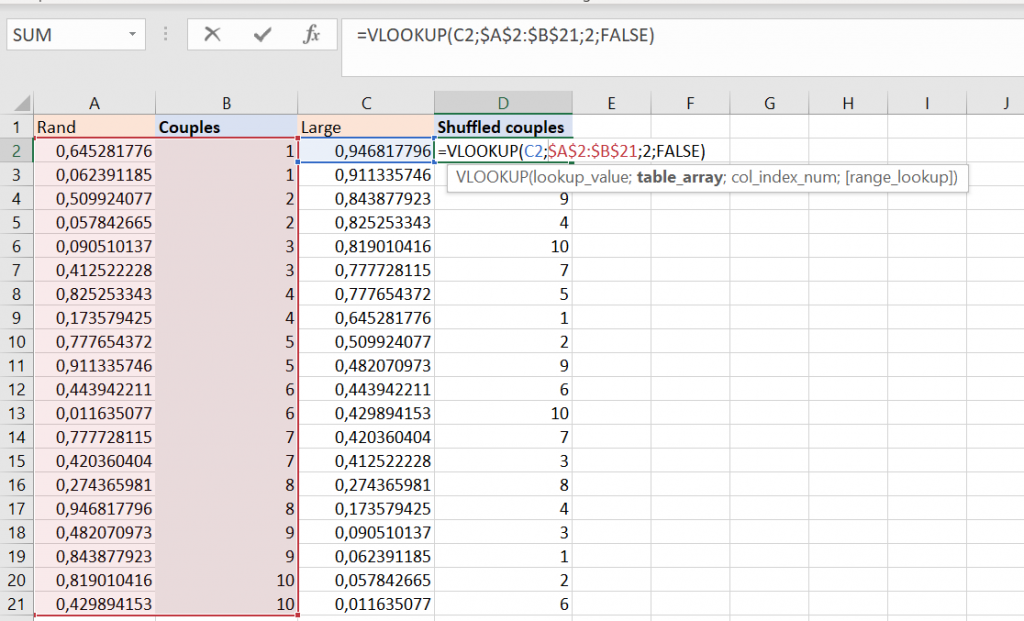
In column A we will insert the RAND() – function for creating random values next to each person.
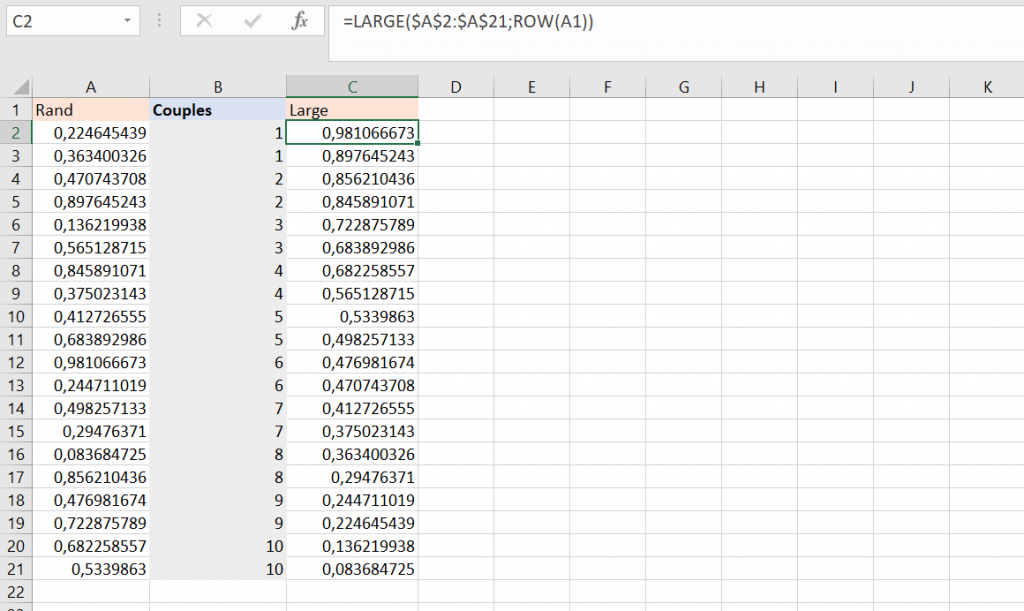
In column C we will sort the random values from column A with the LARGE() – function, that returns the largest value from a matrix. Type in cell C2 =LARGE($A$2:$A$21; ROW(A1))
The second argument specifies the position from the largest value which the functions returns. For example, LARGE($A$2:$A$21; 1) will return the largest value in a matrix, LARGE($A$2:$A$21; 2) will return the second largest etc. Here we use the ROW – function just to make our life a bit easier. Copy the function to the cells below.
You may ask why we wouldn’t just sort the couples after their corresponding random value in column A. This will indeed create a shuffled list, but since we are going to run the simulation thousands of times, we need to do it dynamically. If you refresh the random values with F9, you also need to sort again using this method, thus not dynamical.
We can now create the shuffled list of couples with VLOOKUP, by finding the random value from column C in column A, and returning the person from column B.
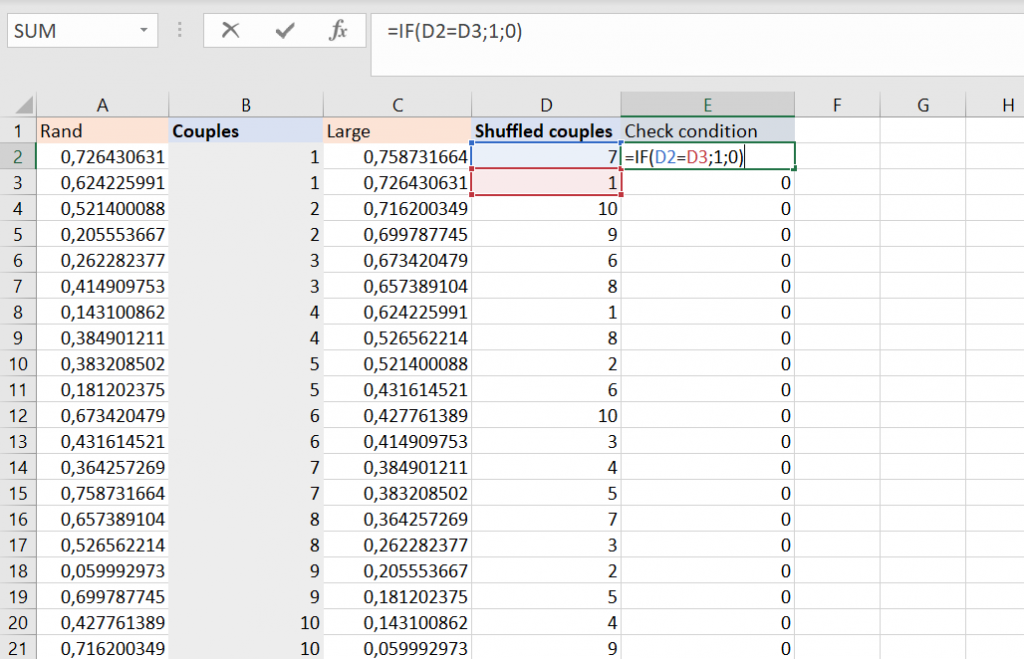
The next step is to evaluate our condition. We need to check if any couple in the row (our shuffled list) stand next to each other. We do this by creating an IF-function in a new column that checks the two first persons and returns 1 if they are a couple and 0 if not. Copy the function to all cells below.
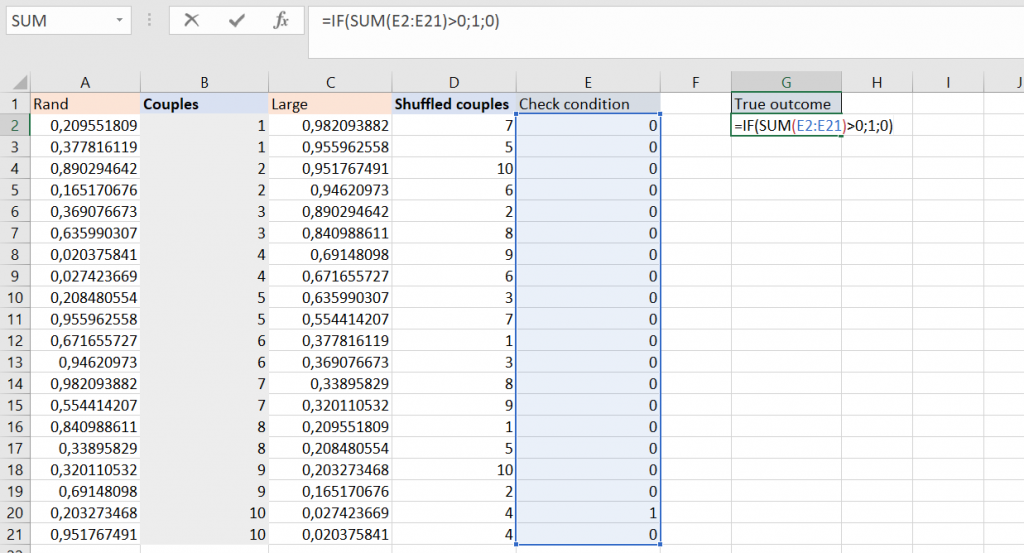
So far, we have created the model for one simulation where we can evaluate if any husband and wife stand next to each other in a randomly created row. However, we need to store the result for our simulation. For this we create an IF-function that stores the value of 1 if our condition in the simulation is met, and 0 if not.
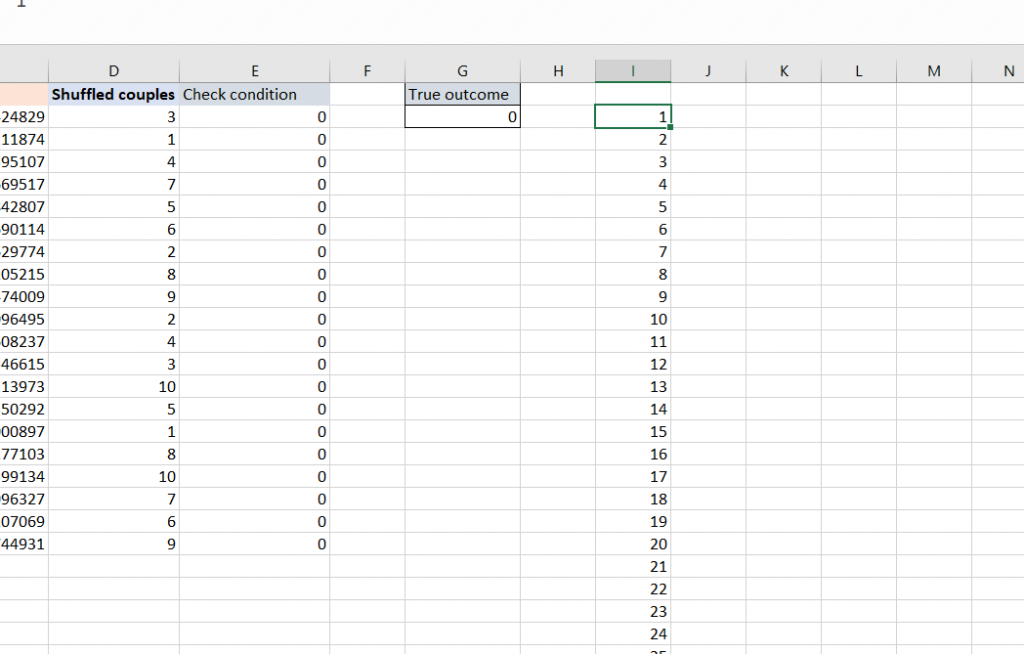
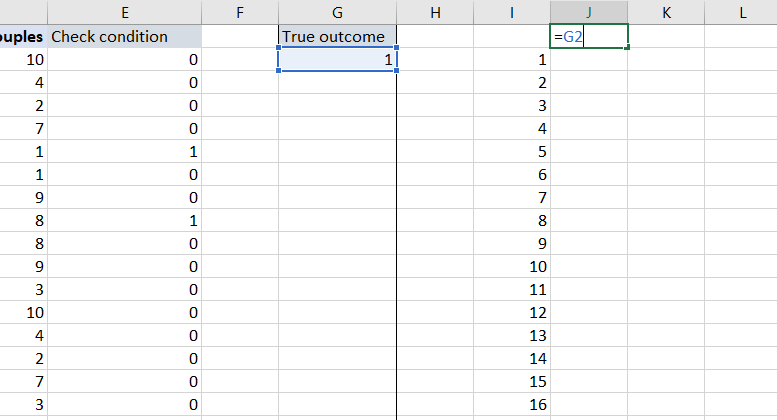
Fill a series with the number of simulations you want to run. We will do 1000, but increasing the number of simulations will naturally also increase the accuracy.
Give cell J2 the value of the outcome (G2)
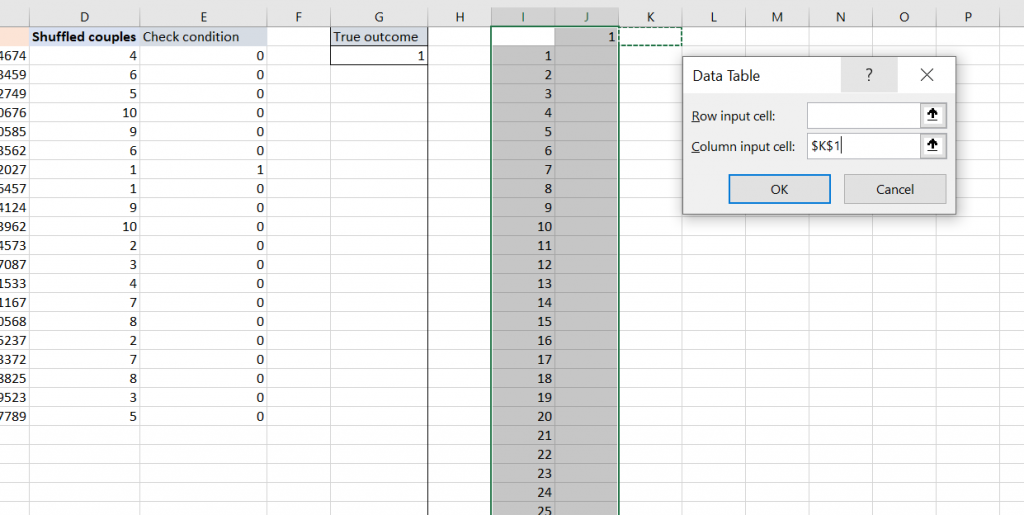
Mark all cells in column I and J from 1 down to 1000, go to Data > What-If analysis > Data Table
Choose an empty cell for “column input value”. This is where Excel will store data while running the simulations.
We can now see the outcomes for each of our 1000 simulations in column J. The only thing remaining is calculating the answer to the question. We simply sum all the true outcomes in column J, divide it by the number of simulations, and subtracting the answer from 1 (100%).
=1 – (SUM(J2:J1001)/1000)
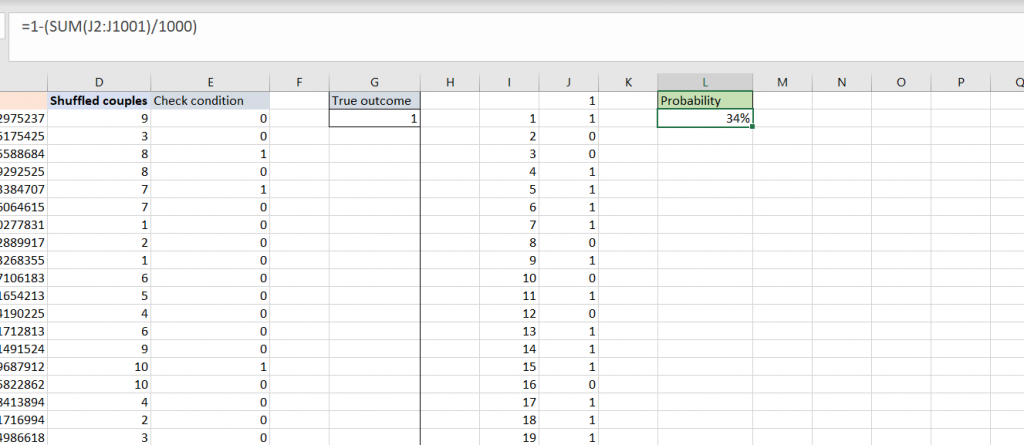
We can now tell that the probability that no husband and wife stand next to each other is roughly 34%.
To run the simulations again you only need to press F9.
If you have any questions, drop a comment below 🙂