How to create a FIFO calculation in Excel
FIFO, or “First In, First Out,” is a concept used to manage inventory and calculate profits. It means that the first assets acquired are the first ones to be sold or used.
📥 Download the example file: FIFO-Calculation.xlsx
A FIFO calculation is crucial when dealing with assets that:
- Were purchased at different prices across multiple transactions
- Were sold in several stages at different prices
- Cannot be uniquely identified or tracked individually
Example applications of FIFO
- In Logistics: FIFO ensures that older inventory is used or sold before newer stock, helping to prevent spoilage, obsolescence, or waste.
- In Finance and Accounting: FIFO is commonly applied to stocks, bonds, or cryptocurrencies. When these assets are sold, capital gains or losses are calculated by subtracting the cost of the earliest purchased units from the sale price.
How to create a FIFO calculation in Excel:
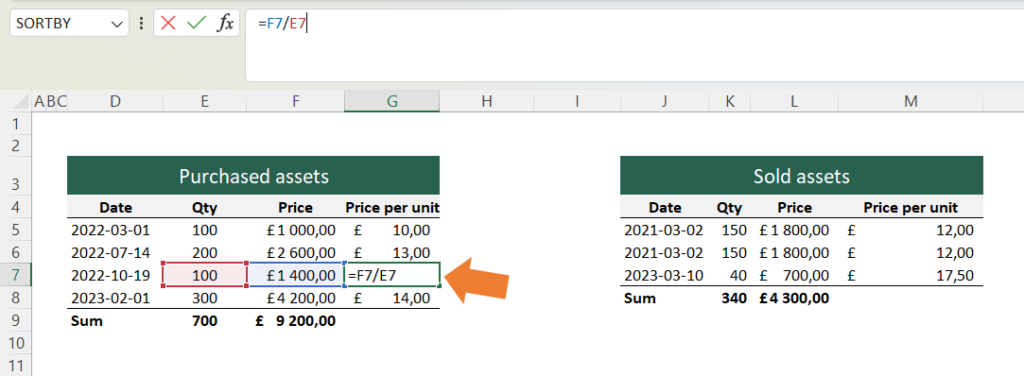
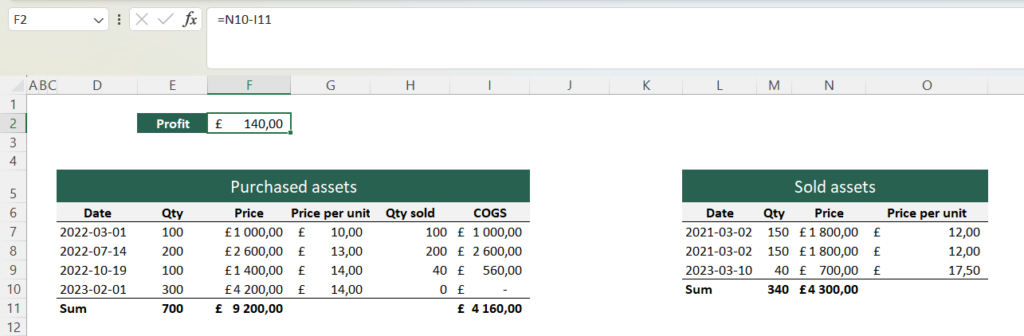
First, create two tables to store data for purchased assets and sold assets.
Next, calculate in a new column how many of the purchased assets have been sold.
For the first purchase, the formula would be:
=MIN( [quantity purchased in purchase no. 1] ; [quantity sold in total])
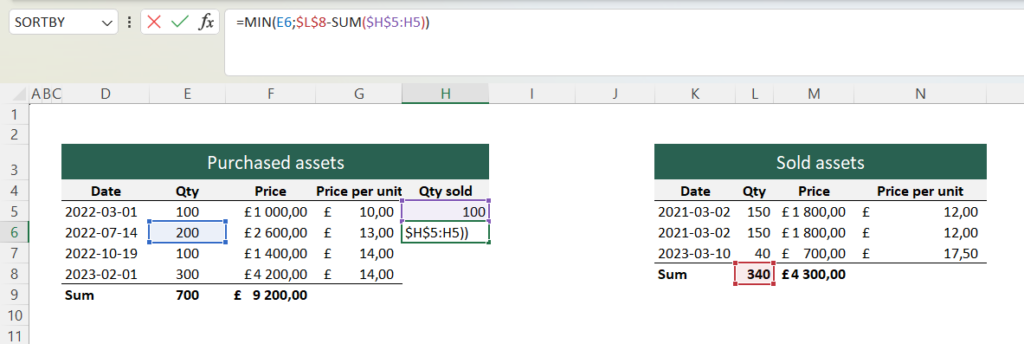
The MIN function returns the smallest of its arguments. In this case, it determines whether all 100 units purchased on 01/03/2022 have already been sold.
For the next purchase, apply a similar formula, but take into account the 100 units already sold. Use a SUM formula to add all the values above and subtract them from the total number of units sold.

At this point, we can see how all 340 units sold are assigned their own cost basis in the table of purchased assets.
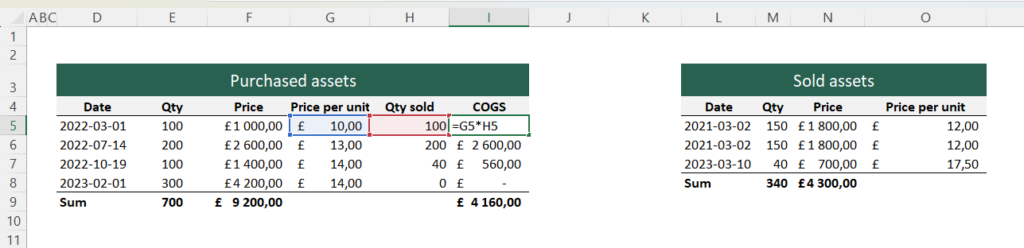
Calculate the cost of goods sold (COGS) by multiplying Quantity Sold by Price per Unit.
The image shows the COGS calculation in Excel.
Finally, calculate the profit or loss by subtracting the cost of goods sold from the revenue.
Note: This calculation only works for products of the same type. If you need to handle multiple product types, you can simply create separate sheets for each product.
Tip: You can further develop this model by, for example, calculating the inventory value of products that have not yet been sold.
Do you want to sharpen your skills even more in your role as a purchaser or logistics professional?
Excel is one of the most important tools in both purchasing and logistics – whether you’re managing forecasts, tracking deliveries, or analyzing costs. With our online course Excel for Purchasers and Logistics Professionals, you’ll gain practical skills that can be immediately applied in your daily work.