
Discover the advantages and benefits of Excel’s PivotTables
Excel’s PivotTables are an incredibly useful tool for analyzing and presenting large sets of data. They allow users to quickly summarize and analyze data in a variety of ways, making it easy to identify trends and patterns that might otherwise go unnoticed. In this article, we’ll explore some of the key benefits of Excel’s PivotTables and why they’re a must-have tool for anyone working with data.
What is a Pivot table?
This introductory lesson from our course The Excel PivotTables Guide explains what a pivot table is, and its’ areas of use.
Summarize large data sets quickly and easily
One of the main advantages of Excel’s PivotTables is the ability to quickly and easily summarize large sets of data. Instead of manually sifting through data and calculating totals, averages, and other metrics, pivot tables allow users to do all of this with just a few clicks.
For example, imagine you have a data set that contains information about customer orders, including the customer’s name, order date, product name, quantity, and price. By creating a pivot table, you can quickly summarize this data to show total sales by customer, product, or date, as well as calculate average order size, profit margins, and other key metrics.
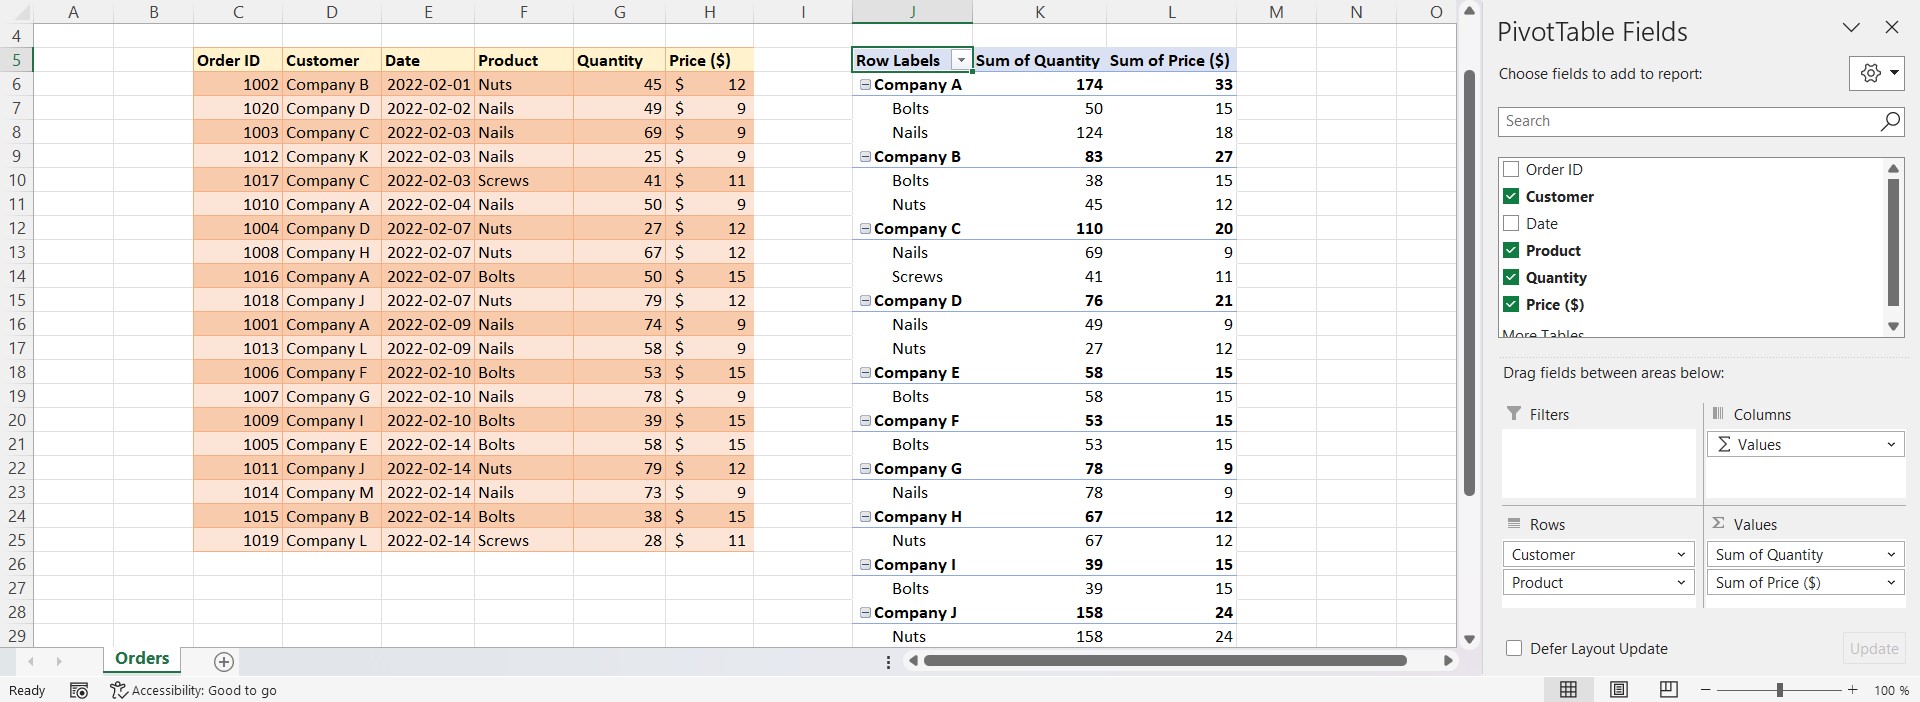 This image shows a Pivot table with total sums of quantity and price total with the company names as categories and the products as sub-categories.
Flexibility in data analysis
Excel’s PivotTables are incredibly flexible when it comes to data analysis. Users can easily change how data is displayed, sorted, and filtered, allowing them to explore different aspects of the data and identify trends and patterns that may not be apparent at first glance.
For example, you can create a pivot table that shows total sales by product, and then filter the information to show only sales for a specific region or time period. Alternatively, you can sort the data by product name to identify which products sell the most, or sort by profit margin to see which products generate the most revenue.
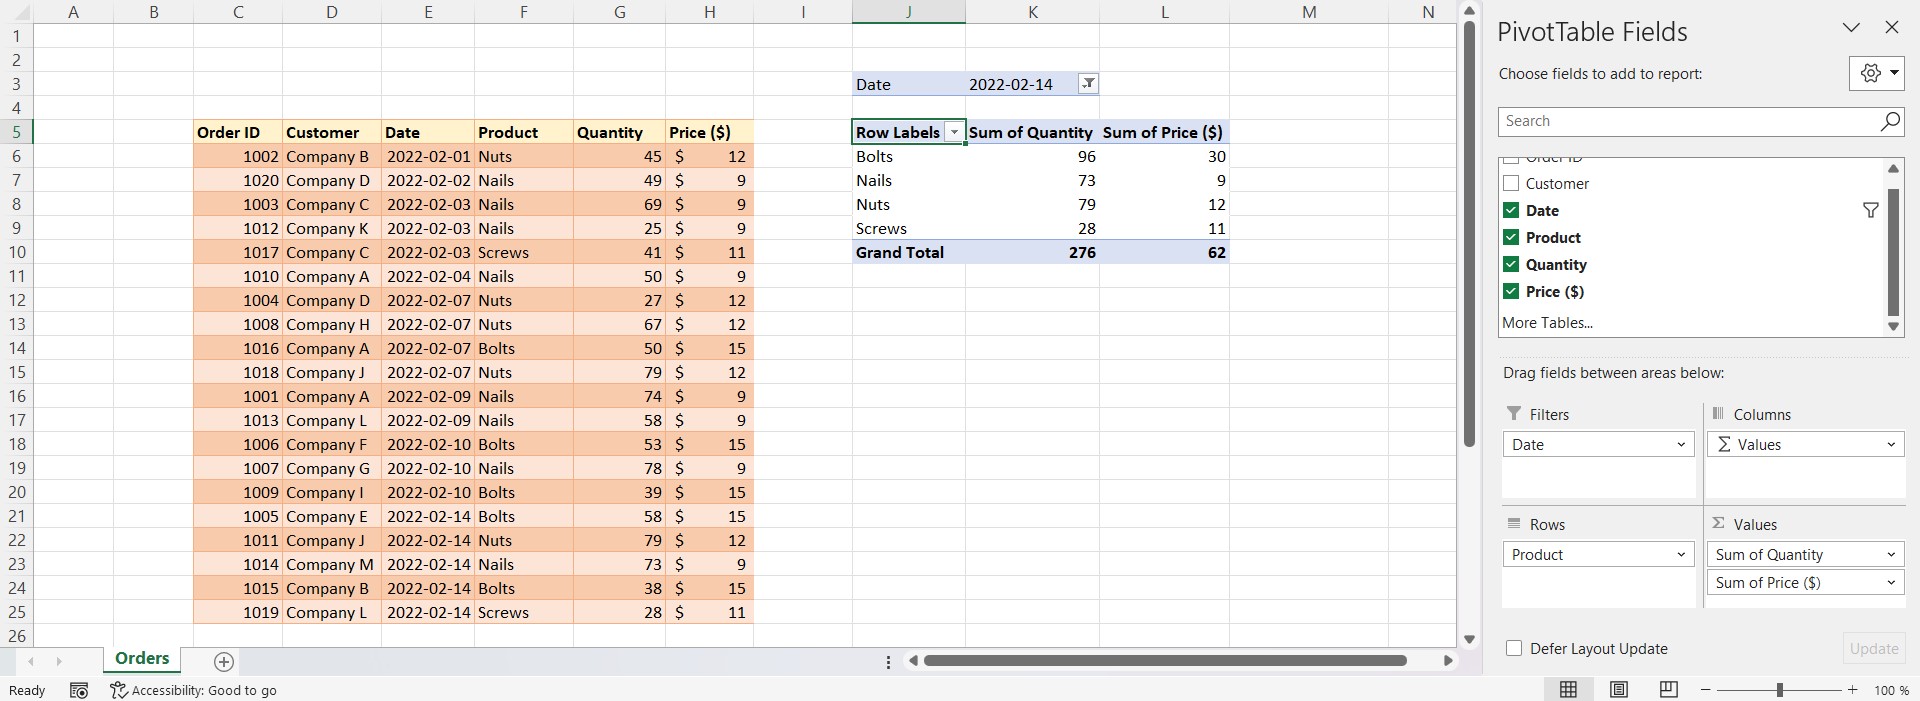 In this image, the pivot table is using a date-filter in which you can choose a specific day.
Ability to create interactive dashboards
Excel’s PivotTables are a great tool for creating interactive dashboards that allow users to explore data in a more engaging and dynamic way. By combining pivot tables with charts, slicers, and other interactive elements, users can create dashboards that allow others to easily navigate and analyze data.
For example, you can create a dashboard that shows total sales by product and region, then allow users to filter the data by date or customer type. This allows users to quickly identify trends and patterns and drill down into the data to explore it in more detail.
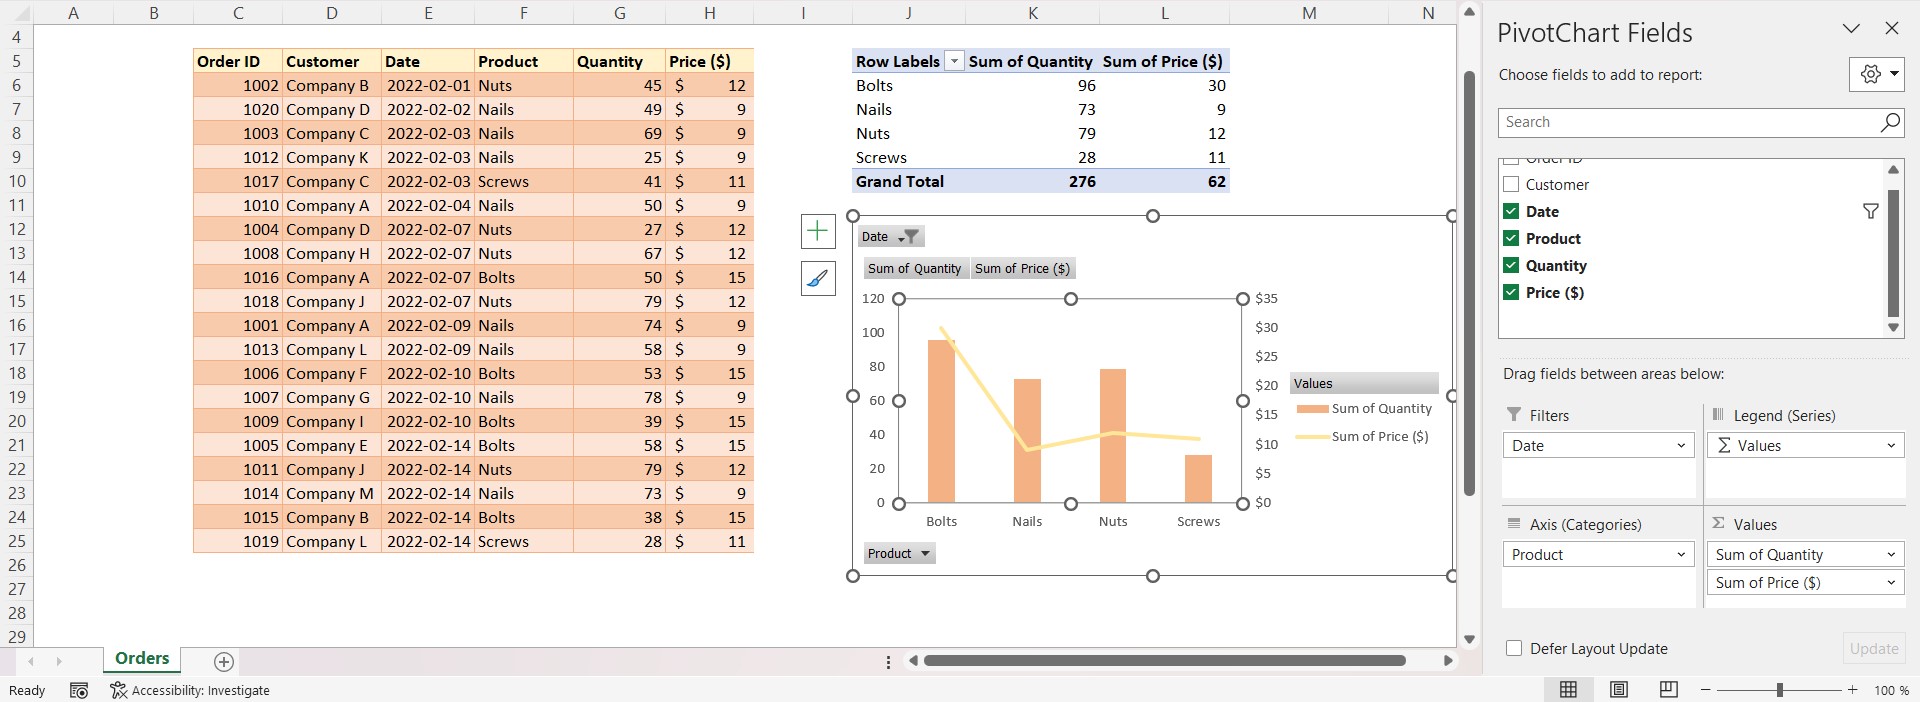 This image shows an Excel PivotChart for which our pivot table is the source to this visualization.
Automatic updates
One of the main advantages of pivot tables is their ability to automatically update when new data is added or existing data is changed. This means that users can create a pivot table and time and then continue to use as new data becomes available, without having to manually update the pivot table each time.
For example, imagine that you have a data set that contains information about customer orders, and you create a pivot table that shows the total sales by product. As new orders come in, you can simply add them to the dataset and the pivot table will automatically update to include the new data.
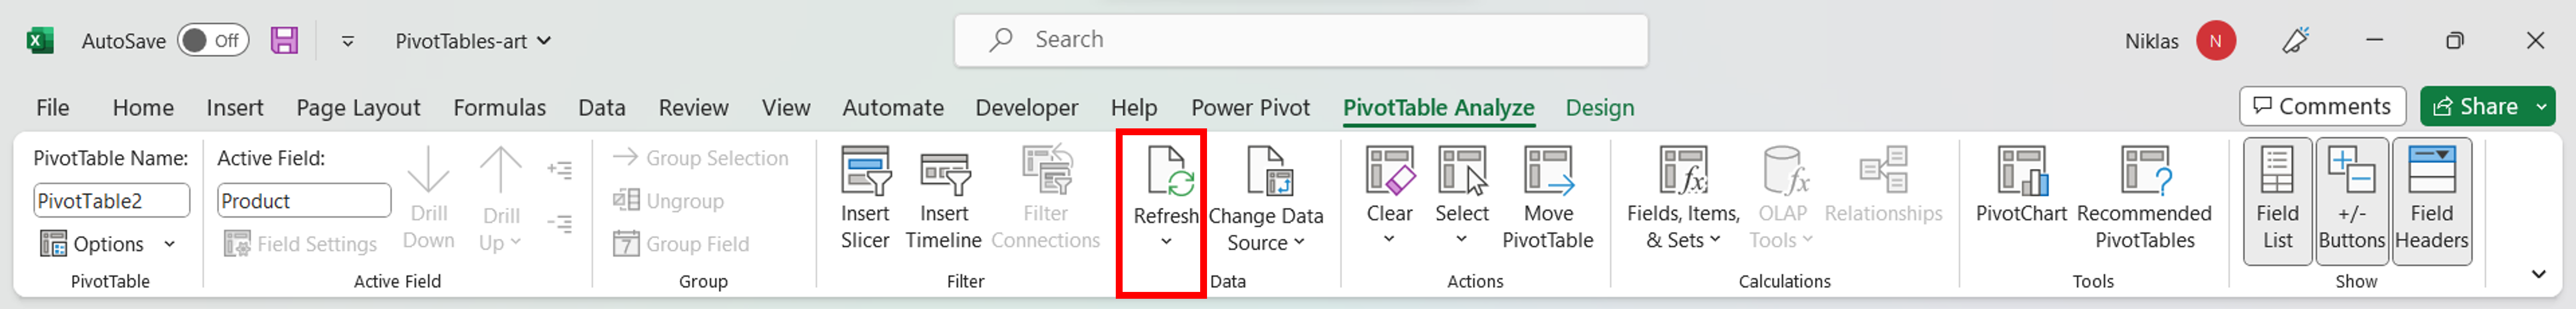 This image shows where we can force the pivot table to refresh.
Improved data accuracy
Another benefit of pivot tables is that they can help improve data accuracy. By using pivot tables to summarize data, users can quickly find any inconsistencies or errors in the data set. For example, if a pivot table shows that the total sales for a particular product are much higher than expected, it may indicate that there is an error in the data set that needs to be corrected.
Efficient report generation
Excel’s PivotTables are an efficient way to generate reports that summarize data in a clear and concise manner. Instead of manually creating reports, use pivot tables to generate reports quickly and easily, saving time and reducing the risk of errors.
For example, imagine that you need to create a monthly sales report that summarizes sales by product and region. By creating a pivot table, you can quickly generate the report and then make the necessary adjustments or adjustments as needed.
Summary
In conclusion, Excel’s PivotTables are an essential tool for anyone working with data. They provide a flexible and efficient way to analyze and present large sets of data, making it easy to identify trends and patterns that might otherwise go unnoticed. Pivot tables allow users to quickly and easily summarize data, create interactive dashboards and generate reports efficiently. With their ability to automatically update and improve data accuracy, pivot tables are a valuable tool for anyone who needs to work with data on a regular basis. By mastering the use of pivot tables, users can unlock the full potential of their data and make better decisions based on insights and trends.