Create interactive Excel Dashboards with 6 steps
Want to create dashboards but lack the necessary Excel skills? In that case, I recommend our course Excel Essentials, which in addition to visualization gives you fundamental Excel skills!
Excel is a powerful tool for organizing and analyzing data. That being said, it can be difficult to make sense of large amounts of information. One solution is to use dashboards, which are a collection of visualizations that makes it easier to see key indicators and trends.
This article will provide you with 6 steps to create interactive dashboards in Excel. The dashboards can help you make better decisions and communicate to your audience more efficiently.
Be aware that there’s are different types of dashboards, and they can be used for different purposes. For example, an operational dashboard may be used to track the performance of a department or team, while a strategic dashboard may be used to track the performance of an entire organization. This article will focus on the creation of an operational dashboard.
The steps are as follows:
- Identification of key figures
- Collect data
- Organize the data
- Create visualizations
- Add interactivity
- Finish and share
Identification of key figures
The first step in creating a dashboard is to identify the key metrics you want to track. These metrics should be specific, measurable and relevant to the outcome. For example, if you’re creating a dashboard for a sales department, you might want to track metrics like sales revenue, number of new customers, and conversion rate.
What is a good key metric?
These metrics vary depending on what is important to your department. There is no right or wrong but they should relate to your business goals and growth. Also, rather a few than a bunch of metrics.
Collect data
Once you’ve identified the key metrics, the next step is to collect the data. This information should be accurate, reliable and recent. You can collect data from a variety of sources, such as your company’s accounting software, CRM system, Google Analytics—or even a simple spreadsheet.
Once all your data has been gathered in Excel, you should proceed to order your data.
Organize the data
Once you’ve collected the data, the next step is to organize it in a way that meets your needs. One way to do this is to use an Excel pivot table. This is a tool that allows you to quickly summarize and analyze large amounts of data. You can use a pivot table to group data by different criteria and then create charts and graphs that make it easy to see trends and patterns.
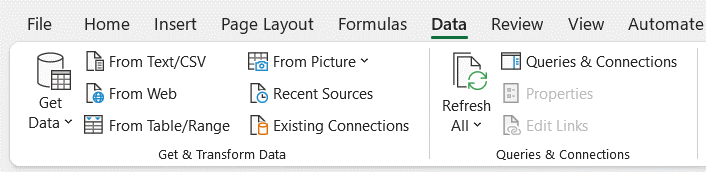
Use Power Query for your ETL
Another way is to use Power Query which is a powerful tool for importing, extracting, loading and transforming. Power Query makes it easy to solve these tasks.
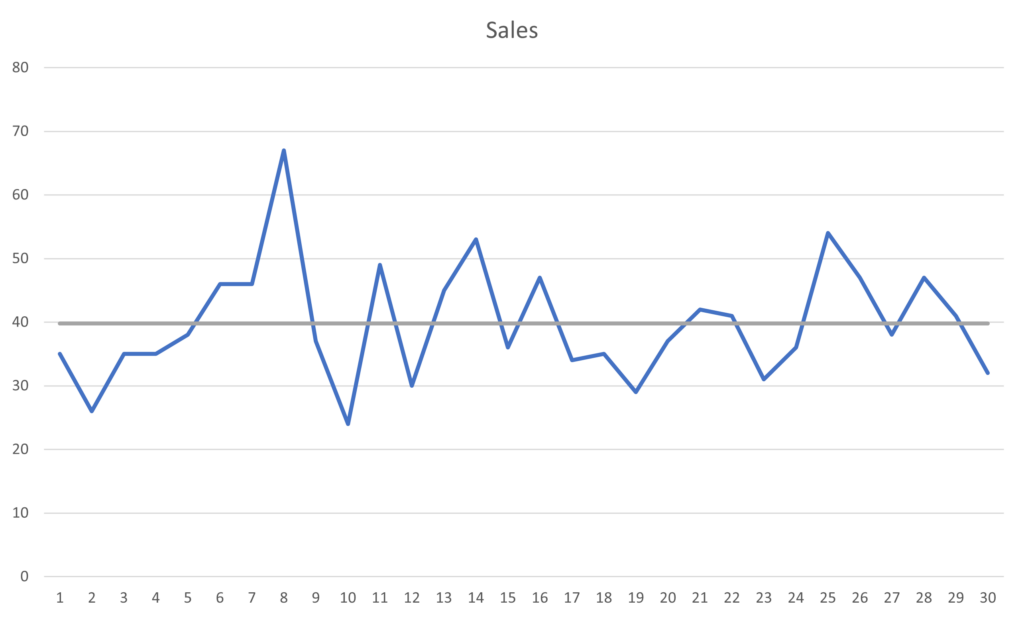
Create visualizations
Once you’ve organized your data, the next step is to create charts and graphs that make it easy to see trends and patterns. Excel has a wide variety of chart types that you can use, such as line charts, bar charts, pie charts, and more elaborate charts.
Which visualizations should I use?
The options are endless regarding charts and graphs. Excel offers around 50 different types of these kind of visualizations. Don’t forget that you also can be creative and use functions and formatting to create customised charts and graphs. Just be aware of the reader of the dashboard – make your visualizations easy to read and use the right visualization for the right type of data.
Add interactivity
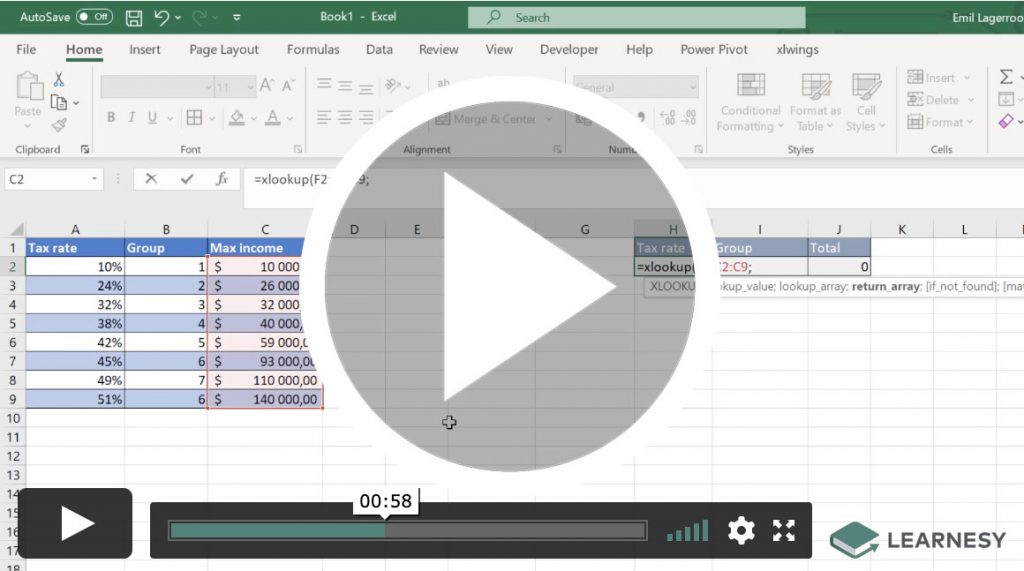
To make your dashboard more interactive, you can add drop-down menus and other controls that allow dashboard users to filter data and see different views of the data. This can be done using Excel’s built-in controls, such as the data validation function, or by using Visual Basic for Applications (VBA) to create custom controls.
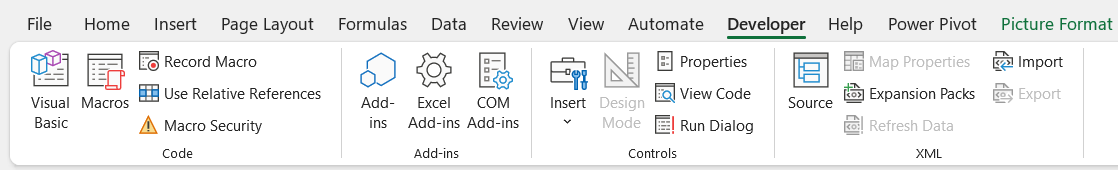
Use the Developer tab
These custom controls can be slicers, buttons, or a scrollbar. They can be quite easily integrated with your visualizations and can be found in the Developer tab. To add labels, checkboxes and scrollbars, just click Insert.
Finally, you should complete your dashboard by giving it the finishing touch. You should do this by adding a title, labels, and other formatting elements that make it easy to read and understand. Once your dashboard is ready, you can share it with others by saving it as a PDF or Excel file, or by publishing it to a website. Creating interactive dashboards in Excel can be a powerful way to organize and analyze data. By following the steps outlined in this article, you can create a dashboard that makes it easy to see key figures and trends. Good luck!