Become an expert in Excel's most fundamental data analysis tool
With this course, you will quickly and effectively learn how to set up and analyze databases. Once you master analyzing data on a deeper level, you will be able to develop sustainable decision-making materials and extract relevant key figures from databases more efficiently. PivotTables summarize your data and can provide quick answers that would otherwise require complex Excel formulas.
- Create smart PivotTables for data-driven decisions
- Filter, group, and analyze with precision
- Strengthen your CV with a diploma
- Practice directly in Excel
- Short lessons – flexible format (approx. 4 hours)
- Learn at your own pace, for 12 months
- Used by companies and universities
Try some lessons in this course for free
Fill in your e-mail address and telephone and we will give you 7 days free access to some lessons in this course.
Try some lessons in this course for free
Fill in your e-mail address and telephone and we will give you 7 days free access to some lessons in this course.
Course manager

Emil
Hello!
My name is Emil and I work as an instructor at Learnesy, where I have been teaching Excel for many years. My goal with this pivot table course is to make you not only proficient in creating and analyzing pivot tables but also confident in your ability to use these skills effectively in your work. Therefore, I have focused on simplifying complex ideas into clear and understandable steps, making the course ideal even for those who are new to this area.
I have integrated feedback from previous participants in the design of the course to ensure it meets various needs and learning styles, which has enriched the course content and made it more accessible for everyone.
I am convinced that a deep understanding of pivot tables provides you with a powerful tool for managing and analyzing data. I look forward to sharing this knowledge with you!
If you have any questions, do not hesitate to reach out to me at:
emil@learnesy.com

Niklas
Niklas creates new courses and manages existing courses on the Learnesy platform. He has studied statistics and has a background in programming and data visualization. In addition to good knowledge of Excel, he has a burning interest in data analysis, and possesses good knowledge of the subject and tools for the field.
Some of the things you will learn in this course:
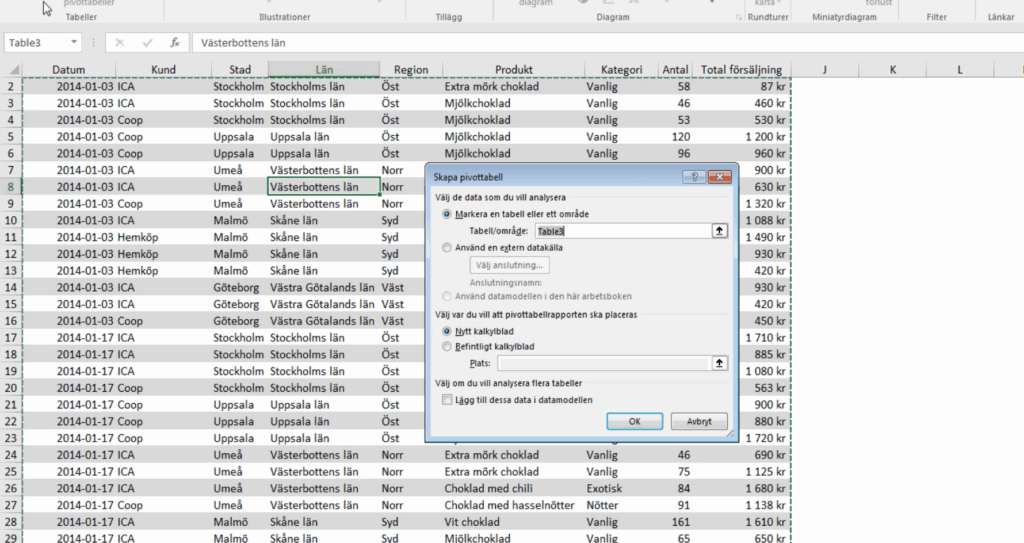
PivotTable basics
In this course, you’ll start by quickly and efficiently learning the basics of PivotTables, including how the database is structured, how it is updated, and why you should always create a table of the database before you make a PivotTable.
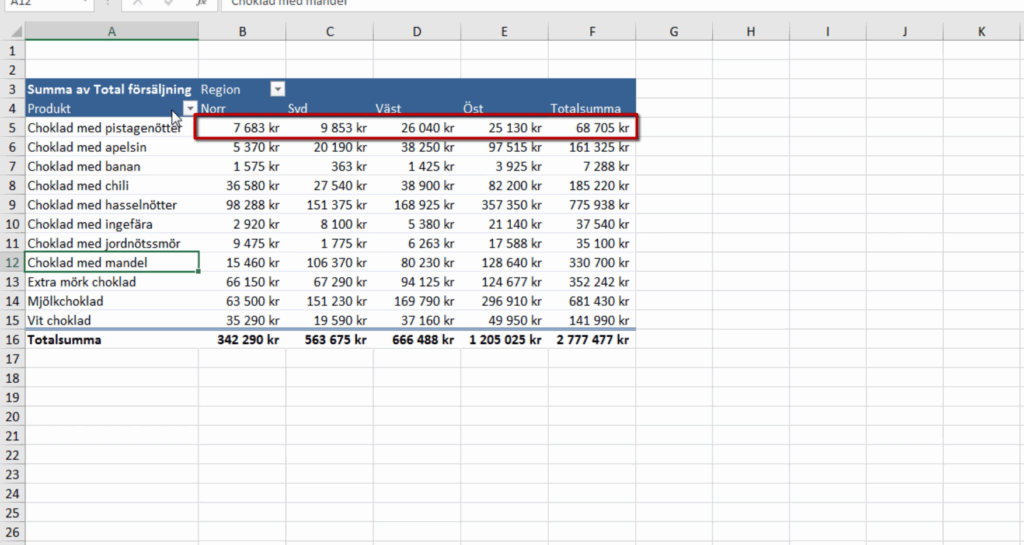
Analyse all types of data
This course helps you analyze all kinds of data, whether it’s revenue over time, costs broken down by department, analysing responses in a survey, etc.
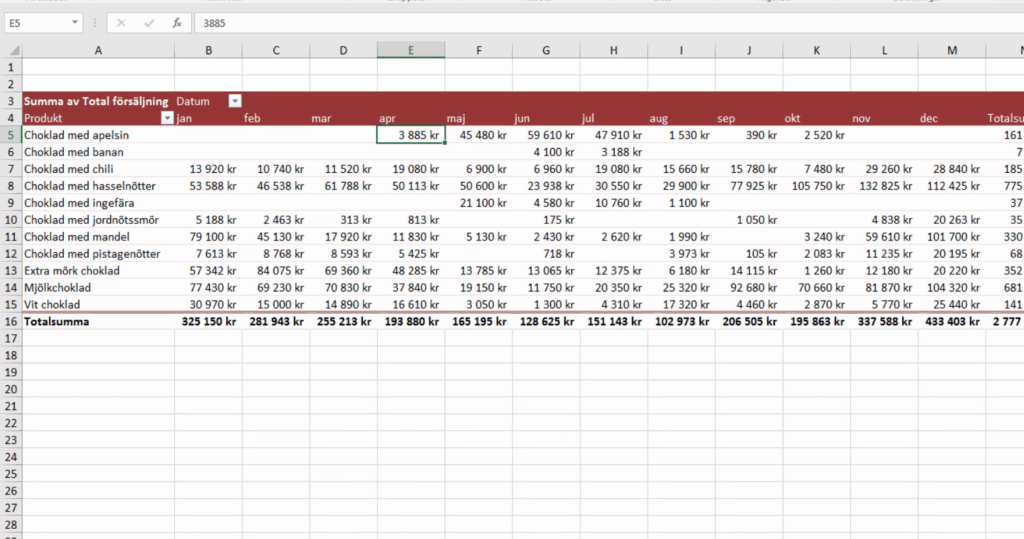
Group data
Many databases contain a column made up of dates or times. This means that in your PivotTable you may need to analyse data and key figures by year, quarter, month, week, or day. PivotTables allow you to efficiently group based on dates, something you’ll learn in this course.
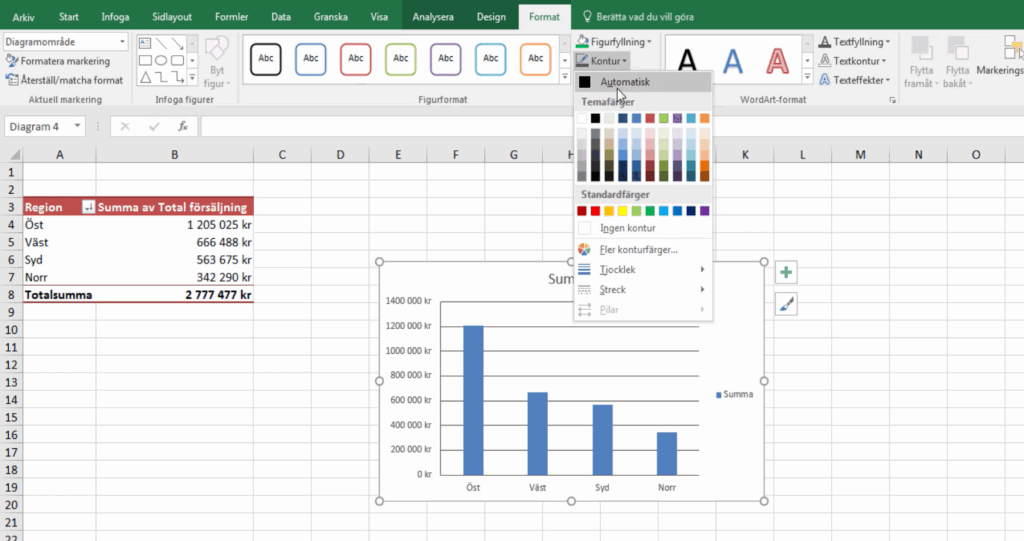
PivotCharts and slicers
It can sometimes be easier to analyse data by seeing it, for example, in the form of a bar or pie chart. It’s an effective way to visually present data after you’ve finished an analysis for a colleague or manager. The combination of charts and slicers can be magical and lifts your PivotTables to new heights.
Course Content
A lesson from the course
In this lesson from The Excel PivotTables Guide, you will learn how pivot table slicers work. This is one of four lessons from the “Slicers” chapter. If you have previously come across report filters, a slicer can be compared to it, but slicers have the advantage of being easier to use. Slicers give us buttons that work just like filters, which makes them very smooth.
The Excel PivotTables Guide is one of Learnesy’s in-depth Excel courses. Pivot tables are used to summarize, analyze, explore and present data. What is the difference between pivot tables and regular tables in Excel? A normal table in Excel is a representation of the facts and figures you have entered. A pivot table, on the other hand, summarizes data that includes different types of aggregation such as mean and sum. Another advantage is the pivot table’s filters that help you easily analyze your data.
More about the course
In this online course, you will learn how to create a pivot table, sort, group, manage sums, and perform calculations in a pivot table. With the help of pivot tables, you will learn to quickly summarize large amounts of data. Use pivot tables to analyze data in detail, and get answers to unexpected questions about your data. After completing the course, you will be able to analyze data at a deeper level. To benefit from the course, you need to have basic knowledge of Excel and an understanding of how tables work.
- Approximately 50 lessons divided into 10 chapters.
- Total video time: 2 hours.
- Estimated time to take the course including quizzes: 4 hours.
- Average duration per lesson: 2.5 minutes.
- Personal shareable certificate after completing the course.

Invest in your knowledge
One course (The Excel PivotTables Guide)
3 495 kr
VAT will be applied.
Educate yourself further with an online course in Excel, Power BI, or PowerPoint – to name a few.
Educational scheme
- Access to all material 24/7 for 12 months
- Complete the course at your convenience
- Repeat freely during the access period
- Courses that are maintained and updated
- Personal and digitally shareable diploma per course
- Schedule and set goals for your learning
- Save your favorite lessons
- Ask your questions in our forum
- Tech Support
- Track and test your knowledge
- Admin features for your team
- LMS integration
- Discounts for multiple users
Business groups
With our platform, we focus on improving your company's skills through customized course content, flexible learning times, and tracking tools to track and test employee progress. We offer courses in several languages
- Personal Account manager
- Personal User Accounts
- Select courses
- Quantity discount
- Statistics
- Unique login domain
- Prior knowledge and follow-up test
- Compare progress with the group
Prices excluding VAT
How Your Learnesy Course Works
At Learnesy, we believe that education should be accessible and straightforward. That’s why we’ve created a platform with you, the user, at the center. Within the platform, you can easily navigate in and between your online courses.
• My Account – here you’ll find your dashboard, where you can access both ongoing and completed courses. Your dashboard is the starting point for your learning journey.
• Get a glimpse of a Learnesy course – from your dashboard, you can easily click through to an ongoing or completed course.
• Favorite and share lessons – found a particularly useful segment or something you want to review again? You can save these by marking them as favorites. You can also share lessons with others who might benefit from them.
• Quizzes and practice exercises – practice makes perfect. Here, you put your theoretical knowledge into action. All quizzes, as well as all course content, can be repeated.
• Congratulations on your course diploma – upon completing a course, you’ll receive a personal, shareable diploma as proof of your new skills.
Have a question? You might find your answer here. If not, don’t hesitate to contact us.
FAQ
What is included in The Excel PivotTables Guide?
This beginner-to-intermediate Excel course teaches you to create, analyze, and enhance data using PivotTables, including grouping, sorting, filtering, slicers, and PivotCharts. It comprises about 50 short lessons, taking around 4 hours total, with practical quizzes and free resources.
How long do I have access to the course?
You get full access to all materials for 12 months from the start, enabling you to revisit lessons anytime.
Will I receive a certificate upon completion?
Yes, you will earn a personalized, web-shareable diploma that you can download and share upon completing all lessons and quizzes.
Who is this course designed for?
Perfect for learners with basic Excel proficiency who wish to gain confidence in data analysis using PivotTables. It’s ideal if you’ve completed Excel Essentials or wish to level up your skills.
Are there quizzes and practical exercises?
Yes! Each chapter concludes with quizzes, and lesson-specific files are provided for hands-on practice.
an I try any part of the course for free?
Absolutely! You can access a 7-day free trial of selected lessons with no payment required.
Do you offer group or corporate pricing?
Yes, we offer discounted course packages for teams and organizations. Contact us to get a tailored offer.
Who can I contact for other questions?
For assistance with content, technical access, or licensing, email us at support@learnesy.com or reach out via the course page.
Related courses


