Take your Excel skills to the next level
In this course, you will learn to work with Excel’s most powerful analysis tools: PivotTables, Power Query, and Power Pivot. You will gain an understanding of how to quickly summarize and analyze data with PivotTables, automate data processing with Power Query, and create advanced calculations with Power Pivot. The course includes practical exercises to help you streamline your work and make better data-driven decisions.
- 12 months of access to the course
- Personalized and digitally shareable certificate
- The course takes approximately 10–12 hours to complete
- Repeat as often as you like
- Practical exercises and quizzes with Excel tasks
- Short lessons designed to support your learning
Try some lessons in this course for free
Fill in your e-mail address and telephone and we will give you 7 days free access to some lessons in this course.


Try some lessons in this course for free
Fill in your e-mail address and telephone and we will give you 7 days free access to some lessons in this course.
Course manager

Emil
Hello!
My name is Emil, and I have had the pleasure of being an Excel instructor at Learnesy for many years. In the Advanced Excel Course, we focus on the powerful tools PivotTables, Power Query, and Power Pivot, with the goal of not only helping you understand them but also enabling you to use them independently for advanced data analysis.

Niklas
Niklas creates new courses and manages existing courses on the Learnesy platform. He has studied statistics and has a background in programming and data visualization. In addition to good knowledge of Excel, he has a burning interest in data analysis, and possesses good knowledge of the subject and tools for the field.
Some of the things you will learn in this course:
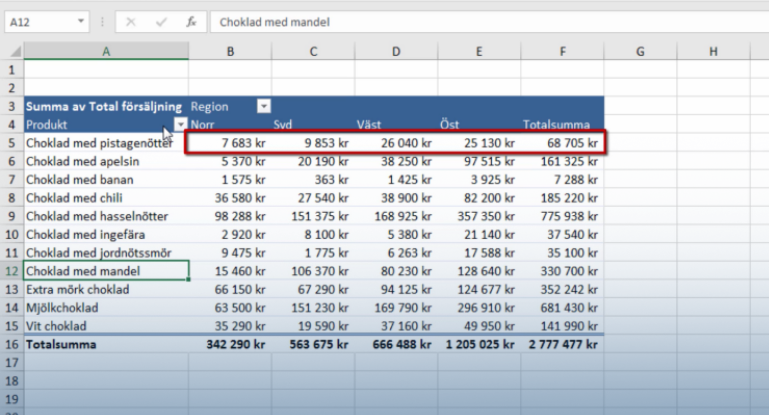
Master PivotTables
PivotTables help you quickly analyze and summarize large amounts of data. You will learn how to sort, filter, group, and create calculations to gain clear insights.
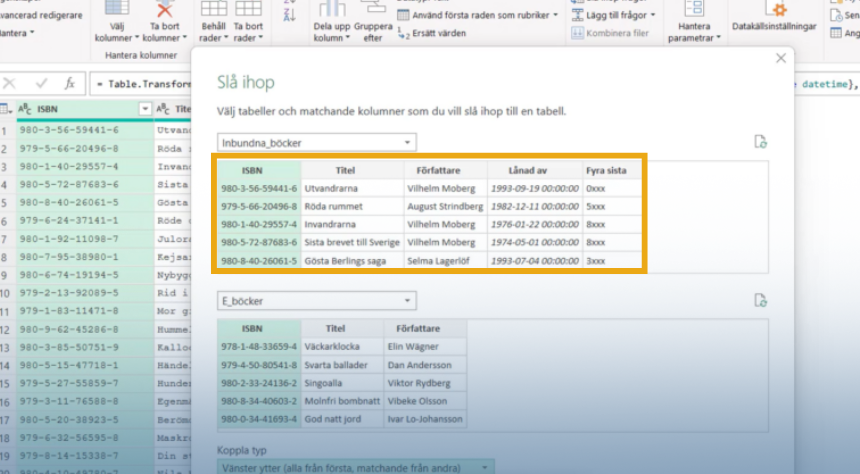
Power Query
Power Query is used to import, clean, and transform data from various sources. You will learn how to automate time-consuming tasks and streamline data processing.
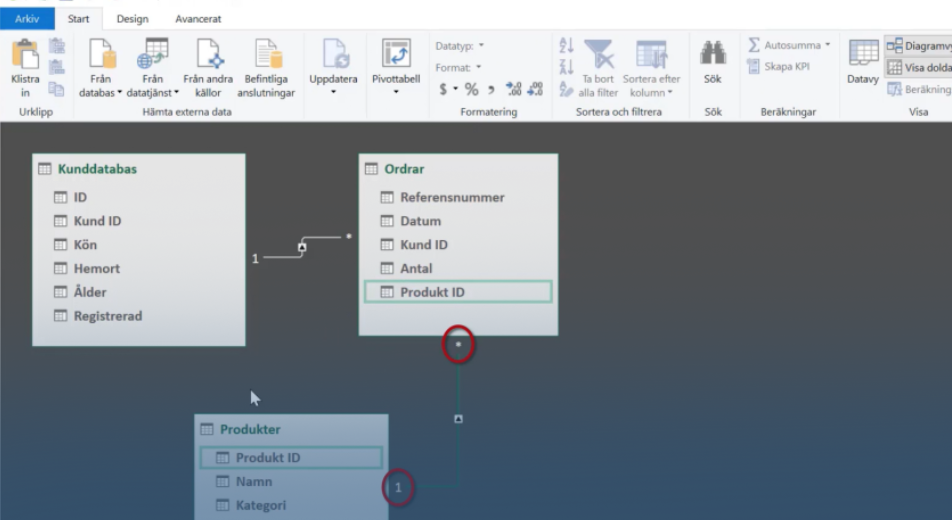
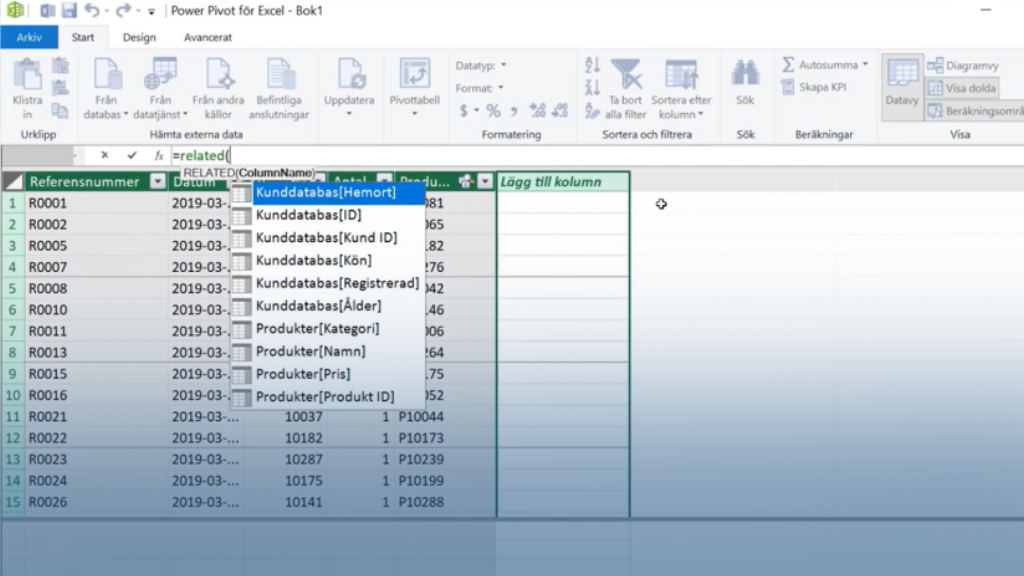
Power Pivot
Power Pivot allows you to build advanced data models and create custom calculations using DAX formulas, providing greater flexibility and deeper analysis.
Analyze Big Data
By combining all the tools, you’ll learn how to transform data, create dynamic models and calculations, and visualize the results to gain insights that drive better decisions.
Course Content
A lesson from the course
In this lesson from Excel Essentials, you will learn how pivot table slicers work. This is one of four lessons from the “Slicers” chapter. If you have previously come across report filters, a slicer can be compared to it, but slicers have the advantage of being easier to use. Slicers give us buttons that work just like filters, which makes them very smooth.
The Excel PivotTables Guide is one of Learnesy’s in-depth Excel courses. Pivot tables are used to summarize, analyze, explore and present data. What is the difference between pivot tables and regular tables in Excel? A normal table in Excel is a representation of the facts and figures you have entered. A pivot table, on the other hand, summarizes data that includes different types of aggregation such as mean and sum. Another advantage is the pivot table’s filters that help you easily analyze your data.
More about the course
In this online course, you will learn how to create a pivot table, sort, group, manage sums, and perform calculations in a pivot table. With the help of pivot tables, you will learn to quickly summarize large amounts of data. Use pivot tables to analyze data in detail, and get answers to unexpected questions about your data. After completing the course, you will be able to analyze data at a deeper level. To benefit from the course, you need to have basic knowledge of Excel and an understanding of how tables work.
This course is for those who want to take their Excel skills to the next level and work more efficiently with advanced data management and analysis. We focus on PivotTables, Power Query, and Power Pivot—three powerful tools that help you structure, transform, and analyze large datasets.
You will learn to summarize and visualize data with PivotTables, automate data processing with Power Query, and build advanced calculations in Power Pivot. Through practical exercises, you’ll have the opportunity to apply your knowledge directly to your work.
Previous experience with Excel is beneficial, but you don’t need to be an expert. The course is perfect for those who already have a basic understanding of the program and want to deepen their skills to work more analytically and efficiently.

Invest in your knowledge
One course (Only Excel Intermediate)
3 495 kr
Billed annually.
VAT will be added at payment.
✔ Access to one course
✔ Practical exercises and certificate
✔ 12 months of access at your own pace
Business groups
With our platform, we focus on improving your company's skills through customized course content, flexible learning times, and tracking tools to track and test employee progress. We offer courses in several languages and for different skill levels, as well as the possibility of hybrid training and integration with your company's LMS system. When you feel ready - contact us for a quote.
- Personal Account manager
- Personal User Accounts
- Select courses
- Quantity discount
- Statistics
- Unique login domain
- Prior knowledge and follow-up test
- Compare progress with the group
Educational scheme
- Access to all material 24/7 for 12 months
- Complete the course at your convenience
- Repeat freely during the access period
- Courses that are maintained and updated
- Personal and digitally shareable diploma per course
- Schedule and set goals for your learning
- Save your favorite lessons
- Ask your questions in our forum
- Tech Support
- Track and test your knowledge
- Admin features for your team
- LMS integration
- Discounts for multiple users
How Your Learnesy Course Works
At Learnesy, we believe that education should be accessible and straightforward. That’s why we’ve created a platform with you, the user, at the center. Within the platform, you can easily navigate in and between your online courses.
• My Account – here you’ll find your dashboard, where you can access both ongoing and completed courses. Your dashboard is the starting point for your learning journey.
• Get a glimpse of a Learnesy course – from your dashboard, you can easily click through to an ongoing or completed course.
• Favorite and share lessons – found a particularly useful segment or something you want to review again? You can save these by marking them as favorites. You can also share lessons with others who might benefit from them.
• Quizzes and practice exercises – practice makes perfect. Here, you put your theoretical knowledge into action. All quizzes, as well as all course content, can be repeated.
• Congratulations on your course diploma – upon completing a course, you’ll receive a personal, shareable diploma as proof of your new skills.
Have a question? You might find your answer here. If not, don’t hesitate to contact us.
FAQ
Who should enroll this course?
This course is for those who have previously taken the course Excel Essentials or who have basic Excel skills, as this is one of Learnesy’s intermediate courses in Excel.
Is there exercises in this course?
This course includes many and short exercises. If you want to follow along with the lessons, you can do so by downloading the files that are attached to each lesson.
All chapters end with a quiz. With some questions there’s a downloadable resource which is needed to solve said exercise.
I HAVE PREVIOUSLY LEARNED Pivot tables IN the Excel Essentials COURSE – IS THIS COURSE FOR ME?
Yes, if you have previously taken the Excel Essentials course, this course will give you a much deeper understanding and practical knowledge of Excel PivotTables.
I HAVE USED EXCEL BEFORE. IS THIS COURSE FOR ME?
Yes. This comprehensive course contains lots of useful features and tips. However, this course requires some prior knowledge in Excel. If you feel that you need to repeat the Excel basics instead, you can take our course Excel Essentials.
HOW LONG DOES IT TAKE TO COMPLETE THE COURSE?
This course takes about 4 hours to complete. To pass the course and receive your diploma, you must complete all the lessons and quizzes that make up each chapter. If, on the other hand, you want to download the lesson materials and follow along practically in each lesson yourself, this course will take a little longer.
WHERE CAN I GO IF I NEED HELP WITH THE CONTENT OF THE COURSE?
If you need help, you can visit our forum or contact us at support@learnesy.com.
We are an enterprise, a team or a school needing a intermediate Excel course. How do we proceed?
Do you want to learn Excel PivotTables and are looking for a business solution for your group? Then get in touch at foretag@learnesy.com.
If you are an educational institution that wants to offer its students supplementary Excel training, you can contact sales@learnesy.com.